Performing Inter-Row Calculations
In this section: How to: Reference: |
The Recap operation in the Financial Report Painter
enables you to perform calculations on data in the rows of a report
to produce new rows. Since these calculations are performed on rows,
each row referenced in the calculation must be uniquely identified
either by the default label assigned by Financial Report Painter
or a label you assign to the row.
To initiate a Recap operation, you must supply the format of
the value that will receive the result of the calculation, and an
expression that defines the calculation you wish to perform. Initially,
the default row label (R1, and so on) serves as the identifying
label for the calculated value. However, it is good practice to
provide a more descriptive label for reference in other calculations.
In the Financial Report Painter, you can type an expression directly
into the RECAP dialog box or use a tabbed dialog box to formulate
your expression.
Note: If you want to create a Recap row that summarizes
the data in existing rows and does not require an expression, you
can use a simple alternative procedure. For details, see How to Create a RECAP Summary Row.
x
Procedure: How to Create a Recap Expression in Financial Report Painter
In
the Design matrix:
-
Select
the row in which you want to perform the calculation.
-
Click
the Recap icon on the Financial Report Painter
toolbar.
or
Right-click anywhere in a blank row (except on
the label) and select Change Type to, and
then Recap from the context menu.
The
RECAP dialog box opens at the Options tab.
-
You
can perform a Recap for a single column, a range of columns, columns
at specified intervals, or for all columns in a row. To perform
a Recap calculation and display output for:
-
A single column. Select
a column number from the Columns drop-down list.
-
A range of columns. Select
the first column number from the Columns drop-down list and the
number appears in the From Column box. Enter the last column number
in the To Column box.
-
Columns with an incremental interval. Select
the first column number from the Columns drop-down list and the
number appears in the From Column box. Enter the last column number
in the To Column box, then enter an increment number. For example,
enter 2 for every other column, 3 for every third column, and so
on.
-
All columns in a row. Click Apply
to row. (The Columns box is disabled.)
-
Assign
a format to the Recap output field. You can either enter the format
in the Format box or click the Format button
to open the Format dialog box. For details, see Format Dialog Box.
-
Type a Recap expression in the input
box, and go to step 10.
or
Click the Advanced button
to expand the Recap Options tab, exposing features that will assist
you in building an expression that may be composed of numbers and
operators (numeric, alphanumeric, Boolean, and conditional), built-in
functions, sort fields, and labels. The expression you create appears
on the Options tab box as you make your selections. This process
is described in steps 6 through 9.
-
Use
the Recap calculator to compose the expression that WebFOCUS will
evaluate. Click numbers plus the operators you need to create numeric, alphanumeric,
date, logical, and conditional expressions.
For details about writing expressions,
see the Creating Reporting Applications With
Developer Studio manual.
You can also add
parenthesis, single quotation marks, and designate uppercase and
lowercase as required by clicking the buttons below the Expression window.
-
To include
a built-in function in the expression, select the function from the
drop-down list. The function is added to the Expression window,
along with placeholders for the required arguments. Type appropriate
values over the argument placeholders, or use the tools provided
to select the values you need.
For details, see the Using Functions manual.
-
To include
a row label in your expression, click the label in the Labels drop-down
list. (Note that the list shows default row labels unless you have
defined explicit labels.)
-
To include
a vertical sort (BY) field in your expression, click the field in the
By Fields drop-down list.
Tip: You can use a sort field value in a RECAP command
to allow the model to take different actions within each major sort
break. For example, in a request sorted by REGION, the following
calculation would compute a non-zero value only for the EAST region:
IF REGION EQ 'EAST' THEN .25*CASH ELSE 0;
-
Click
the General tab and type the title for the Recap
calculation that you want to display on the report. Though optional,
this entry is generally included in financial reports.
-
Notice
that the row label (R1, and so on.) appears automatically in the Label
box of the General tab. This label is used to reference the result
of the Recap calculation. To supply an explicit row label to replace
the default label on the matrix, type it into the Label box. (The
default label is retained internally.) Though optional, this entry is
generally included in financial reports.
-
Click OK to
complete the expression.
RECAP
appears in the Row Type column of the matrix, along with the expression,
label, and title you define.
x
Reference: RECAP Dialog Box
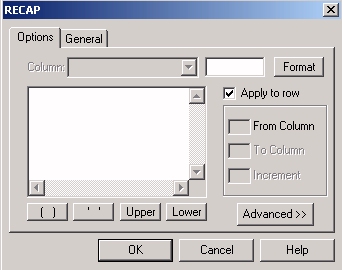
Options Tab
Several options in this dialog box enable
you to specify the column or columns to which you want to apply
a Recap formula:
-
Column
-
Identifies a single column that will contain the Recap formula.
This is also the column in which the Recap output will appear on
the report. You can choose the column from the drop-down list.
-
Apply to row
-
Indicates that the same Recap formula is to be used for all
columns in the row. The Columns box is disabled when you select
Apply to row.
-
From Column/To Column
-
Defines a range of columns to which the Recap formula is
to be applied.
-
Increment
-
Indicates an interval of columns in the range that should
have the Recap formula applied. For example, a value of 2 will apply
the formula to every other column.
Note: Although not
directly supported by options in the RECAP dialog box, there are
a number of other ways in which you can identify the columns to
which you want to apply the Recap calculation: column address, column
value, and cell notation. To use these features, you must type the
required syntax directly into the expression box in the RECAP dialog
box.
For details,
see Creating Financial Reports With Financial Modeling Language (FML).
-
Format box
-
Identifies the field type, field length, and display options
that will be used for the Recap output. The field type can be alphanumeric,
numeric, or date.
-
Format button
-
Opens the Format dialog box, which is designed to help you
choose the format for your Recap output. See Format Dialog Box.
-
Expression box
-
Displays the expression used to generate the Recap output.
Type
the expression, or click the Advanced button
to expand the Options tab, exposing features that will help you
create the expression.
-
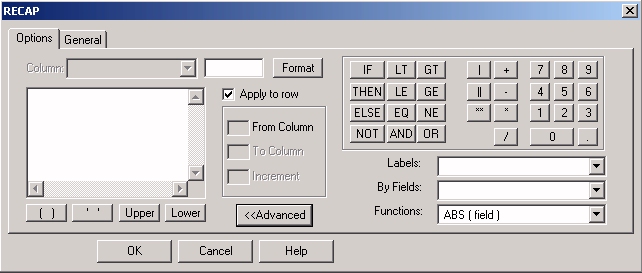
Advanced button
-
Expands the Options tab to make it easy to add functions,
numbers, operators, labels, and sort fields to your expression.
Your selections are reflected in the Expression box.
-
Calculator
-
Provides numbers and operators that
you can use to create numeric, alphanumeric, Boolean, and conditional
expressions. Click the desired number or operator to add it to the
formula in the Expression box.
Four
additional buttons below the Expression box enable you to:
- Enclose a value
in parentheses. Click the ( ) button to add
parenthesis.
Parentheses affect the order in which WebFOCUS performs
the specified operations.
For information on when to use parentheses
in expressions, see the Creating Reporting
Applications With Developer Studio manual.
- Enclose alphanumeric
or date literals in single quotation marks. Click the '
' button to add quotation marks.
- Convert entries
in the expression box to upper or lowercase. Click the Upper or Lower button
to specify case. Note that field names are case-sensitive.
-
Labels
-
Lists the labels (default or explicitly defined) that you
can use in your expression. Select the label you want to add from
the drop-down list. Your selection is added to the formula.
-
By Fields
-
Lists the vertical sort (BY) fields that you can use in your
expression. Select the fields you want to add from the drop-down
list. Your selection is added to the formula.
-
Functions
-
Lists all available built-in functions that you can add to
your expression. A function is a program that returns a value.
Select
a function from the drop-down list. Then, in the Expression box,
highlight each argument and substitute the value or field name you
wish to use by typing or by selecting items from other drop-down
lists. For details, see the Using Functions manual.
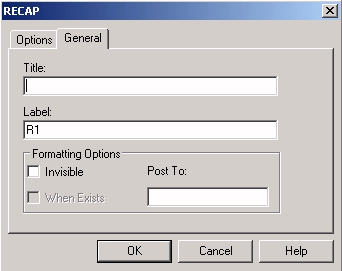
General Tab
-
Title
-
Enables you to specify a title for the Recap calculation
in which this title will appear on the report.
-
Label
-
Lists the default label for the Recap row. You can replace
the default row identification label with an explicit row label
that you want to reference on the left hand side of an expression.
You can think of this label as a calculated value or as a variable that
holds the result of the Recap calculation. It can also be used as
part of the expression in subsequent Recap formulas.
-
Formatting Options
-
The following options apply to individual rows in the report.
You can also apply these formatting options from the Row Properties
check boxes above the matrix.
-
Invisible
-
Creates a Recap expression for use in a calculation, but
does not display its results on the report.
-
Post To
-
Posts the output of a Recap line to a work file. This line
can then be used as though it were provided in a DATA row. For details,
see Saving and Retrieving Intermediate Report Results.
x
Reference: Format Dialog Box
The Format dialog box enables you to
define the format of the output to be generated by a calculation.
Note: The
Format button is available in the Compute, Define, and RECAP dialog
boxes to define field formats for temporary fields and subtotal
calculations. Click the Format button to
open the Format dialog box.
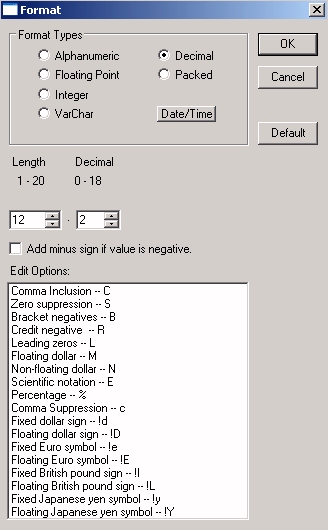
The Format dialog box has the
following fields and options:
-
Format Types
-
Specifies the format of the current field. The field type
can be alphanumeric, numeric, or date/time.
-
Date/Time
-
Opens the Date and Time Formats dialog box, where you can
assign date and time formats, and apply date and time display options.
For more information,
see the Creating Reporting Applications With
Developer Studio manual.
-
Length
-
Specifies the length, in characters, of a field. Enter a
number in the Length box, or click the arrow
buttons to specify a number.
|
Field Format
|
Length
|
|---|
|
Alphanumeric
|
1-4096 (default, 20)
|
|
Floating Point
|
1-9 (default, 7.2)
|
|
Integer
|
1-11 (default, 5)
|
|
VarChar
|
1-4096 (default, 20)
|
|
Decimal
|
20.18 (default, 12.2)
|
|
Packed
|
33.31 (default, 12.2)
|
|
Dynamic
|
Select a Format Field.
|
Note: For numeric fields, include the
decimal place in the length.
-
Decimal
-
Specifies the number of decimal places to the right of the
decimal point in a Decimal, Packed Decimal, or Floating Point field.
-
Add minus sign if value is negative
-
Check this option to display a minus sign to the right of
negative numeric data.
-
Edit Options
-
Adds display options to numeric field formats to control
how the field will appear on reports.
Example: Calculating RECAP Expressions in the Financial Report Painter
This
example shows two RECAP expressions, with the second using values
derived in the first.
The
first RECAP expression calculates TOTCASH (as TOTAL CASH) by adding
the values in rows 1 to 3. The results of the calculation will appear
in all columns. This is designated using the Apply to
Row check box on the RECAP Options tab. See RECAP Dialog Box.
The
second RECAP expression calculates GROCASH, as CASH GROWTH (%):
- TOTCASH(1)
refers to total cash in column 1.
- TOTCASH(2)
refers to total cash in column 2.
- The resulting
calculation will appear in column 2 (LAST_YR) of the row labeled
CASH GROWTH(%). This is designated in the Columns box on the RECAP
Options tab.
The output is:
x
Procedure: How to Create a RECAP Summary Row
To
create a row in which existing data in other rows is summarized:
-
Place
your cursor in a column that contains numeric data, then highlight
the values you want to sum. The values to be added may be contiguous
or non-contiguous.
-
Click
the Make RECAP (Rows)
 icon on
the Design toolbar.
icon on
the Design toolbar.
-
A new
RECAP row appears in the Row Type column, below the last row in
the matrix. The formula representing the sum of highlighted values
(for example, R1 + R2 +R3) appears in the new row, in the column
that contained the values.
Tip: Use
this technique when the calculation you wish to perform is a simple
addition of values that does not require an expression. For an illustration
of this technique, see Emphasizing a Row Using Border Lines.
xCreating RECAP Expressions Using a Drag-and-Drop Operation
RECAP expressions may be created in an FML matrix by
dragging individual values from their original source cells and
dropping them into a target cell in the same matrix. A valid source
cell is any cell that contains numeric data, and a valid target
cell is any cell that is either empty or contains only RECAP expressions.
To create a RECAP expression, you can drag a value from any valid
source cell, located in any row or column in an FML matrix, to any
valid target cell in the same matrix. You should position a target
cell in a section of your report, where data cells end and empty
cells begin, at the end the rows or columns where the source cells
are found.
x
Procedure: How to Create RECAP Expressions Using a Drag-and-Drop Operation
To
create a drag-and-drop RECAP expression:
-
Position
the pointer in a valid source cell.
-
Click
the source cell, hold the left mouse button down, and press the Shift
key.
-
Drag
the source cell contents to a valid target cell and release both
the left mouse button and the Shift key.
While dragging the source cell contents, you should observe
that a symbol, which appears as a circle with a slash through it,
is displayed when your mouse pointer is hovering above cells where
you are not allowed to drop the source cell value. When you reach
a valid source cell in the matrix, the symbol will no longer appear.
By default,
using a drag-and-drop operation to create a RECAP expression places
a plus sign (+) between all values dragged into a RECAP cell.