In this section: Reference: |
Most of the work you will do in the Financial Report Painter occurs in the Design matrix, where you can add:
You can also format rows, columns, and cells in the Design matrix.
The following matrix contains a simple income statement that tracks revenues, costs, and expenses.
Note: Like all Financial Report Painter requests, this one originated in Report Painter. See Report Painter With the FOR Field Selected.
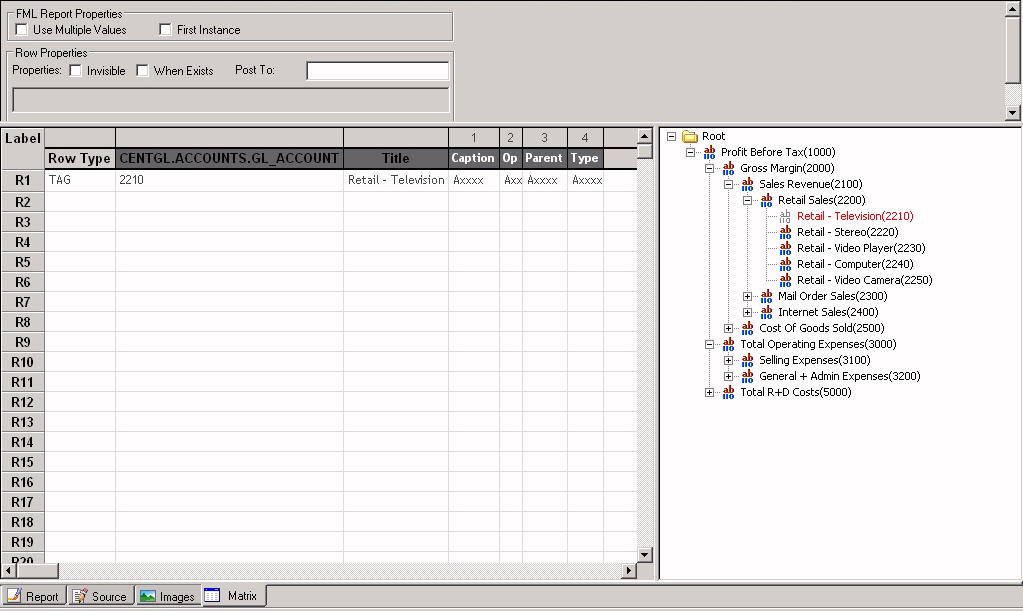
The Financial Report Painter enables you to define the elements of your report request. It consists of the matrix itself, the panel containing FOR field values from the data source, a set of toolbars, and a set of Properties check boxes.
Below the matrix are four tabs that enable you to switch quickly between the Matrix view, the Source code, the Report as it appears in Report Painter, and the images that may have been embedded in the report.
Are supplied by default in the first column of the matrix, where they provide unique identifiers for each report row. They become important as you place various report elements in the rows of the matrix. These labels enable you to identify rows to be used in calculations. You can also use the labels to identify rows and cells for formatting.
You can replace the default labels with more meaningful labels of your own.
Identifies the type of information included in each row of the report. This column appears by default, but initially the values are blank. The Financial Report Painter adds the row type as you define each element in the report. Row types are: TAG, DATA, RECAP, TEXT, BAR, and PICKUP.
Contains the field you designated in Report Painter. FOR is the underlying command that enables row-by-row control in a WebFOCUS financial report. A report can only contain one FOR field. The data values of the FOR field, or calculations based on those values, are stacked over each other in the matrix.
Lists any titles you define for rows. For TAG rows added through the TAG dialog box, and for DATA and RECAP rows, the title is blank unless provided. For TAG rows dragged onto the matrix from the FOR field values, the tag value appears as the default row titles.
You can assign multiple data values in a single row and then assign an identifying title to the group.
If you are working with hierarchical data for which captions have been defined in the Master File, the captions appear in the Title column. For details, see Reporting Dynamically From a Hierarchy.
Each field you specify in Report Painter (including the FOR field) appears as a column title in the matrix. If you include any sort (BY) fields, they appear before the others in the report.
Column widths are initially adjusted to fit the longest item in each column. As you type into the matrix or enter values in dialog boxes, you can adjust the column widths as required by dragging or double-clicking the boundary lines.
You can include additional columns in your report without returning to Report Painter. For details, see Adding and Deleting Columns.
FOR field values panel
This panel displays the values of the FOR field in a resizable, scrollable window to the right of the matrix. You can add values to the Design matrix by dragging or double-clicking.
If you are reporting against a hierarchy, the values in the panel reflect the hierarchy tree. For details, see Reporting Dynamically From a Hierarchy.
Design toolbars
Financial Report Painter toolbar icons, which appear above the matrix, enable you to perform the following tasks:
The toolbar icons are:
|
Icon |
ToolTip |
Description |
|---|---|---|
|
|
Report Options |
Opens the Report Painter Report Options dialog box, which control all report-wide properties. |
|
|
Run |
Runs the report. |
|
|
Design mode |
Toggles between the full Design matrix and a subset of the matrix columns for preview purposes. |
|
|
Show properties |
Shows the properties of the selected row in the dialog box in which those properties were defined. |
|
|
Tag |
Opens the TAG dialog box where you can specify values and properties for the TAG row. |
|
|
RECAP |
Opens the RECAP dialog box where you can create an expression that derives the value of the RECAP row and assign row properties. |
|
|
Text |
Opens the TEXT dialog box where you can enter a row of text, or a blank row. |
|
|
Bar |
Opens the BAR dialog box where you can specify an underline character. |
|
|
Data |
Opens the DATA dialog box where you can assign properties, such as title and label, to a row whose data you supply directly in the matrix (rather than retrieving it from a data source). |
|
|
Pickup |
Opens the PICKUP dialog box where you can assign row properties, such as title and label, and indicate the name of a file from which to pick up a row of previously posted data. |
|
|
Add a row |
Adds a blank row at the bottom of the matrix.
|
|
|
Insert a row |
Inserts a blank row between existing rows in the matrix. Also opens the Insert Row dialog box where you can select a row type (for example, Tag, Recap, Data, Text, Bar, or Pickup). You can also specify values and properties, such as title and label. |
|
|
Delete a row |
Removes the selected row from the matrix. |
|
|
Make RECAP (Rows) |
Creates a RECAP row based on the sum of other values in the matrix. (This option applies when no expression is required.) |
|
|
Make RECAP (Cells) |
Creates a RECAP cell based on the sum of other values in the matrix. (This option applies when no expression is required.) |
|
|
Increase/Decrease Size |
Increases or decreases font size by one measurement at a time. |
|
|
Bold, Italic, Underline |
Adds emphasis using the selected style. |
|
|
Justify |
Justifies (Left, Right, or Center) the characters in the selected cell, or applies the default justification. |
|
|
Font Color |
Applies the color chosen from the palette to the characters in the selected cell. |
|
|
Match All Styles |
Provides a drop-down list with options that are primarily used to copy format characteristics from one column and apply the characteristics to another column. To activate the button, you must multi-select two or more columns. When you click one of the options from the drop-down list, the Report Painter copies the style from the first column selected and applies the style to all other selected columns. Depending upon your selection, certain toolbar buttons may be inactive or unavailable. The styling options are: Match All Styles, Match Font, Match Grid/Border, Match Background Color, Match Conditional Styling, Match Justification, and Match Width Attributes. |
The Properties area above the matrix is a resizable, scrollable region in which you can assign appropriate properties to the report or to specific row types.
If an editable cell is selected in the matrix, its content appears in the Properties box below the check boxes. To enter values in a selected cell, type in the Properties box and press the Enter key.
Row Properties check boxes affect individual rows:
Suppresses the display of a row.
Suppresses the display of a row when no data exists.
Enables you to enter the ddname for a file to which you want to post a row of output for later pickup and use.
FML Properties check boxes affect the entire report:
Enables you to add the same data value to multiple rows in the Design matrix. For example, the same value can exist as a single value in one row, as part of a range in another row, and in a calculation in a third row.
For data that has not been structured as a hierarchy, values continue to be listed in the FOR field values panel after being used in a row. Without this option, values are removed from the list after being used.
In a hierarchy, a used value remains in the FOR field values panel, where it appears in red to indicate that it has already been added to the matrix.
In both instances, you can reuse the value as required.
Applies when you are reporting against a data source with shared members, such as ESSBASE, in which the same data can be defined multiple times with different hierarchy field values.
Unless this option is selected, data shared by two different parents will be counted twice in an aggregation operation. When this check box is selected, the Financial Report Painter applies the .FST prefix operator to all summed numeric columns in the report, ensuring that a shared value is only counted once.
How to: |
If you are familiar with the underlying FML syntax, as you work in the graphical tool you may wish to view the source code generated by the Financial Report Painter.
To toggle from a report request in the matrix to the corresponding code, click the Source tab below the Financial Report Painter.
To open the source code window, click the Source tab below the matrix.
The following source code corresponds to the matrix for the Income Statement in Designing Your Financial Report. Notice that the code shows the entries made in Report Painter, as well as those made in the Financial Report Painter.
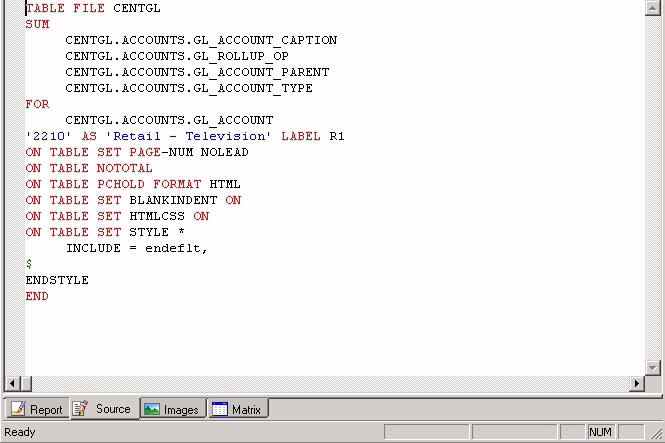
Tip: While you can edit the code that appears in this window, it is recommended that you not do so. Changes to Painter-generated code may cause problems when you try to reopen the procedure in the tool.
How to: Reference: |
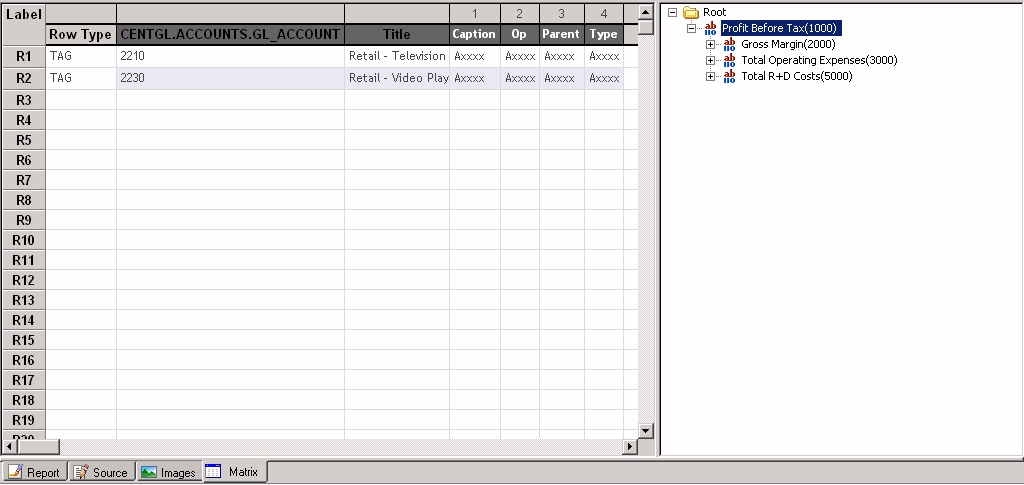
You will generally work in Design mode as you build your request, but you may periodically wish to toggle to Preview mode to see the columns of the matrix that will actually be represented in the report output. For an illustration of Preview mode, see Financial Report Painter Matrix in Preview Mode.
Click the Design mode icon on the Financial Report Painter toolbar. The matrix display switches to Preview mode, which shows a subset of the information in the Design matrix.
In Preview mode, the Financial Report Painter displays the following:
| WebFOCUS |


