|
In this section: |
Resource Governor Usage Monitoring facility allows you to monitor requests as they are submitted by users, and logs information about request usage. This information includes the usage statistics associated only with data retrieval or data manipulation in the case of MODIFY or MAINTAIN. This request information is stored in Resource Governor Usage Monitoring tables. You can specify the Monitor Preference, which allows you to change what information is collected for monitored data sources.
The Web Console enables you to administer Resource Management.
You can:
- Enable/Disable Monitoring & Governing.
- Maintain the Repository.
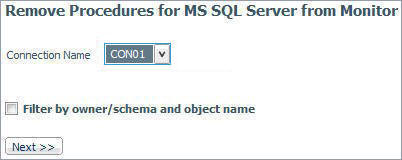
- Remove Resource Management.
- Enable/disable global monitoring.
- Set monitoring preferences.
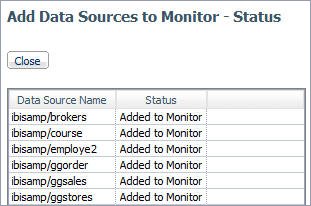
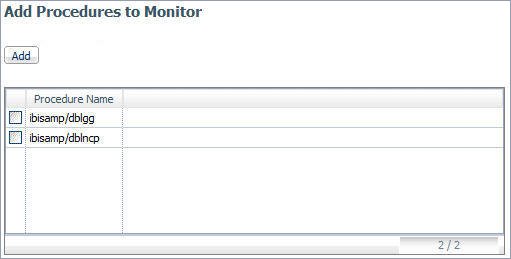
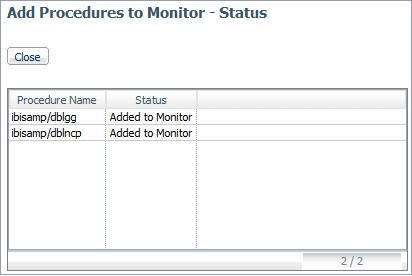
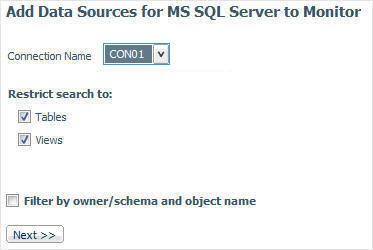
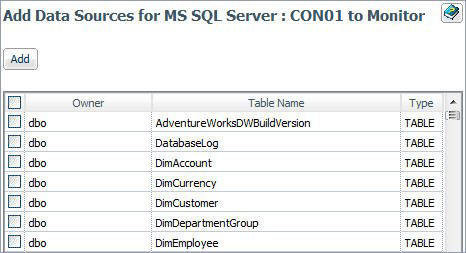
- Add data sources to be monitored.
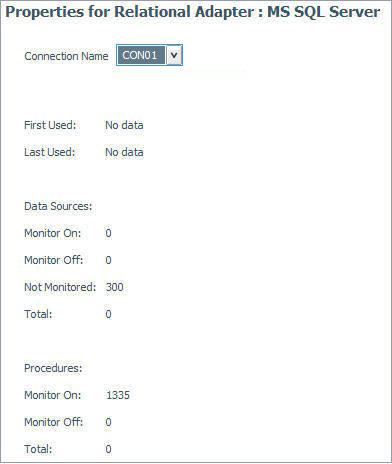
- View the properties of data sources and the sample data they produce.
- Access reports.
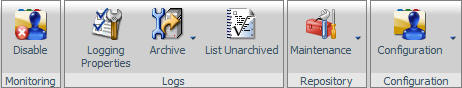
Access to these tasks is provided by the Resource Management link on the toolbar.
The following image shows the hierarchical navigation menu that is available when the Resource Management link is selected.