How to: |
You can pass any data generated by Report Painter or the Report canvas directly into RStat. The Report canvas is accessible in App Studio, and Report Painter is accessible in Developer Studio. You can develop your data, join various data sources, build virtual fields, and create data sets to pass to RStat for modeling activities. Run RStat extracts the data defined within your report and loads it directly into RStat. Within each report, you can customize the name of the hold file to be created and the path where it should be placed. You can customize this for every FEX or run with the defaults.
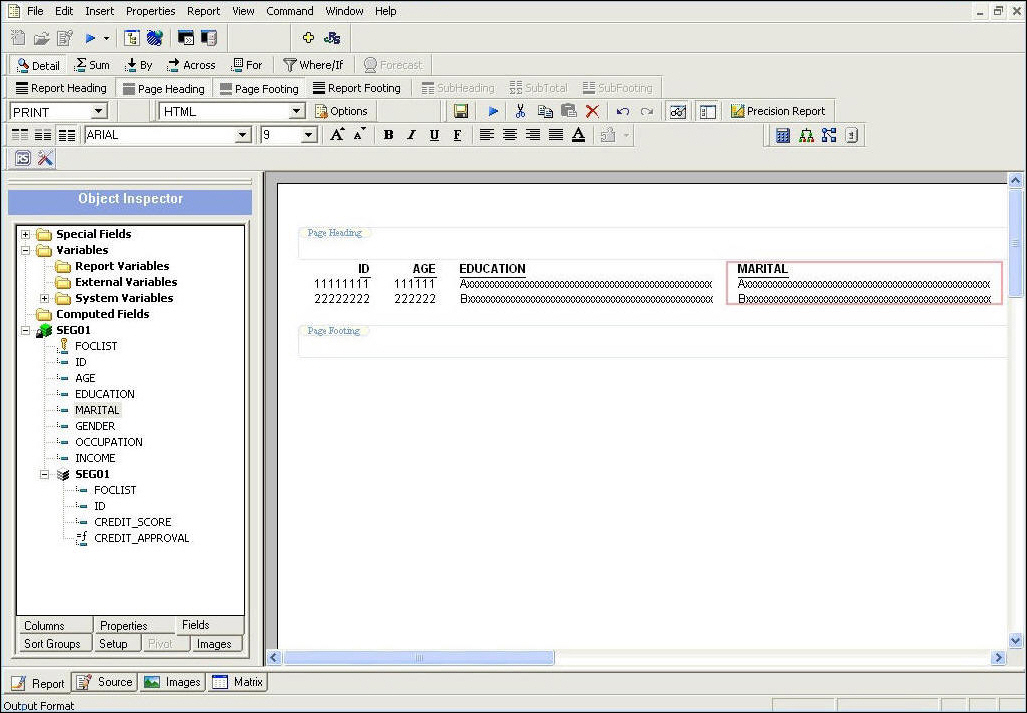
There are several RStat specific options available from the Model toolbar in Report Painter in Developer Studio and the Modeling tab in the Report canvas in App Studio, such as Run RStat or Launch RStat and RStat Model Configuration. The following image shows the Report Painter in Developer Studio.
Model configuration allows you to name the hold file that will be used to pass the model data from Report Painter or the Report canvas into RStat and define the path where the hold file should be placed. You can set your own hold path default to be used in all FEXs. The model configuration settings are saved in the FEX when you customize them and each time you execute Run RStat.
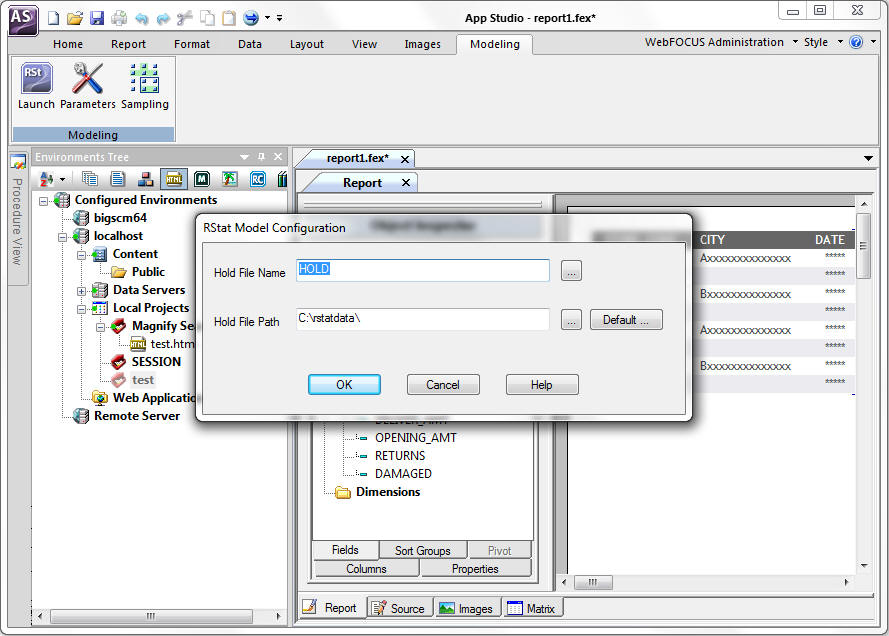
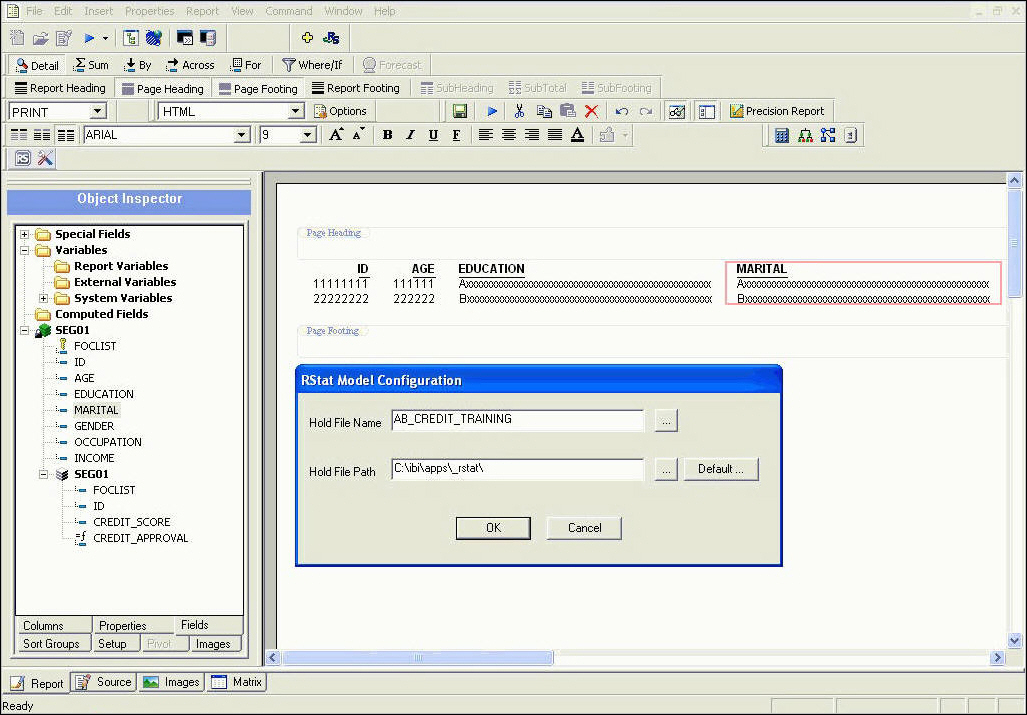
The RStat Model Configuration dialog box opens, as shown in the following image.
 button
on the toolbar.
button
on the toolbar.
The RStat Model Configuration dialog box opens, as shown in the following image.
To launch
RStat, on the Modeling tab, in the Modeling group, click the Predictive
Modeling command  .
.
When RStat opens within App Studio, two windows are opened. RStat opens in front within the minimized R Console window. The R Console window is open for user interaction and custom R scripting. The fields that you define on the Report canvas are imported into RStat in the order specified in your report.
To
use Run RStat, click the Run RStat button  on the
toolbar to pass the current data selection to RStat.
on the
toolbar to pass the current data selection to RStat.
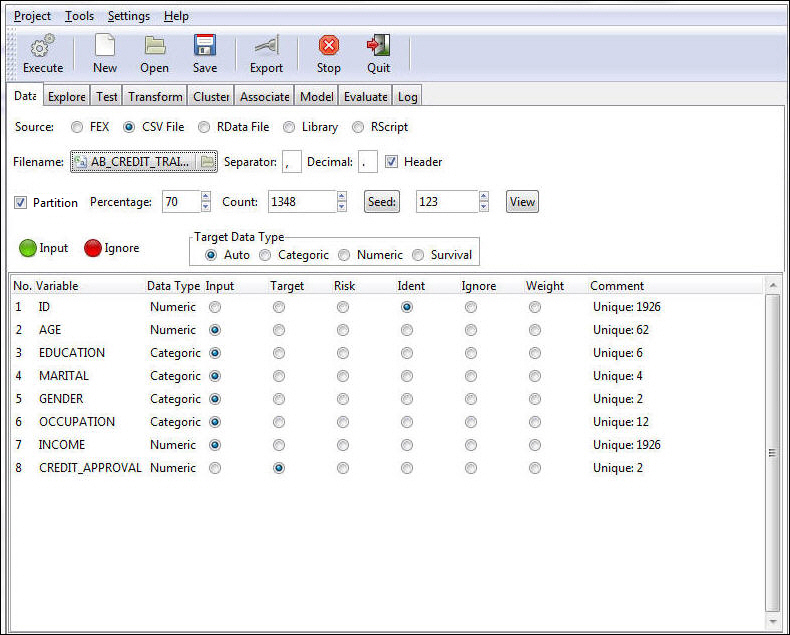
RStat opens with the data that you specified. An example of this data is shown in the following image. Notice that the title bar displays the name of the hold data file you specified, the data type is indicated as a .CSV file, the file name is identified within the Filename control, and the fields within your data are displayed in the Variable grid.
| WebFOCUS |