- Open an Excel file, and select a cell that will be used as the starting point for your query results.
-
On the Add Ins tab, in the Menu Commands group,
click WebFOCUS, and then click Create
Query.
You can also right-click any cell and click Create WebFOCUS Query.
-
In the Web Server URL field, type
the URL for a web server in your reporting environment. You can
also choose a web server from the drop-down list.
The following image shows an example of the Web Server Connection page.
Note: If the connection information was not specified during the creation of a previous query, you must supply the Web Server URL.
For more information, see Manually Defining Web Server Connection Settings.
- Click Next.
-
If this is your first query during your Excel session,
or if your WebFOCUS Quick Data settings require you to sign in for
each query, the Sign in to WebFOCUS dialog box opens.
-
If your WebFOCUS Quick Data add-in is configured to
use MR Authentication, type your valid Managed Reporting credentials.
-
If the Reporting Server requires explicit sign on,
type valid Reporting Server credentials.
Note: If the On-Demand Reporting Server Logon option has been activated, you will not be prompted to sign in with valid WebFOCUS credentials after the first report query during an Excel session. If this option has not been activated, you will be prompted to sign in before every query. For more information, see WebFOCUS Quick Data Options.
-
If your WebFOCUS Quick Data add-in is configured to
use MR Authentication, type your valid Managed Reporting credentials.
- Click Sign In.
-
When the Select a Folder page of the WebFOCUS Quick Data
Wizard opens, select a folder or HTML File from the list of available
data sources, and then click Next, as shown
in the following image.
-
When the Data Source Selection page of the WebFOCUS Quick
Data Wizard opens, click the Master File you want to use, and click Finish,
as shown in the following image.
WebFOCUS InfoAssist opens, as shown in the following image.
- Use InfoAssist to build and run a query that returns output data to Excel.
This example covers multiple aspects of creating a new report query using the WebFOCUS Quick Data tool from an Excel file.
- Open an Excel file, and select a cell that will be used as the starting point for your query results.
- On the Add-Ins tab, in the Menu Commands group,
click WebFOCUS, and then click Create
Query.
The Web Server Connection page of the WebFOCUS Quick Data Wizard opens.
- In the Web Server URL field, type the
URL for a web server in your reporting environment, as shown in
the following image. You can also choose a web server from the drop-down
list.
The following image shows an example of the Web Server Connection page.
Note: If you type the URL, do not end it with a slash mark (/). The Advanced Connection Option values that will be added to this URL automatically when creating the connection begin with a slash mark (/) already. Any slash mark (/) you enter here will be redundant and will prevent the connection from completing properly.
- Click Next.
Note: If your configuration has been limited to the use of SAFs, select an HTML form inside a content folder that you have access to, and then click Next. Continue to create the report from a structured ad hoc form (SAF). For more information, see, How to Create a Report Query from a Structured Ad Hoc Form.
- When the Select a Folder page of the WebFOCUS Quick Data Wizard opens, click a folder that contains the master file you need. When the list of Master Files accessible by the selected folder appears, click Next.
- When the Data Source Selection page of the WebFOCUS Quick Data
Wizard opens, click WF_RETAIL_LITE from the
Data Source list, and then click Finish.
Note: The WF_RETAIL_LITE data source is part of your Reporting Server setup.
WebFOCUS InfoAssist opens, as shown in the following image.
- In the Query pane, click By.
- In the Data pane Dimensions folder, expand Product,
and Product, and then double-click Product,Category and Product,Subcategory.
InfoAssist assigns the Product,Category dimension to the By Query bucket in the Query pane, as shown in the following image.
- In the Data pane, expand Measures and
double-click Cost of Goods, Gross
Profit, and Quantity, Sold.
InfoAssist assigns the three measures to the Sum Query bucket in the Query pane, as shown in the following image.
- On the Home tab, in the Report group,
click Column Totals.
The Live Preview refreshes, and displays the column totals, as shown in the following image.
- Click Save.
If you selected the Show Properties dialog when the query is created option in the WebFOCUS Quick Data Settings dialog box, the Properties dialog box opens, as shown in the following image.
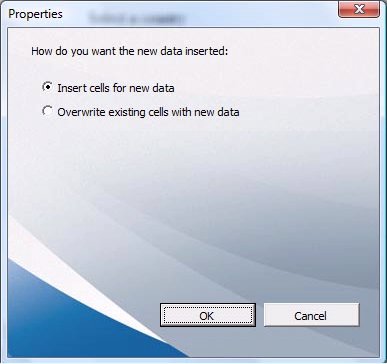
This dialog box contains the following options:
- Insert cells for new data. Retains results from multiple queries in the same Excel worksheet. Depending on where new data is inserted, data from an earlier request may shift its location in the spreadsheet.
- Overwrite existing cells with new data. Overwrites existing data to replace results with those from the new request.
- Click Insert cells for new data, and
then click OK.
The report query data appears in the Excel file, as shown in the following image.
Note: When you share an Excel file that was created using Quick Data, with another user, the user can view the saved data. To edit the request or refresh the data in the shared Excel file, the user must install the Quick Data add-in.