In this section: |
The Home tab contains the most commonly used commands and options from the Format, Design, Filter, Clipboard, and Report groups. It is shown in the following image.
Note: The Clipboard group displays in Document mode only.
The Format group displays a menu of output formats and buttons to toggle between creating a report (default) or a chart. It also contains a menu from which you can create an image file from a chart.
When you run a report, the output is created in the format that is currently selected. You can also select output format options on the Format tab, in the Output Types group, and on the status bar, from the output format drop-down menu.
Note: If you are running InfoAssist Basic, your output format options are limited. PowerPoint and active PDF are not supported for charts and reports. PDF, Excel, active report, and active Flash are not supported for charts.
Report or Chart. Determines whether report-specific or chart-specific functionality is available in the InfoAssist tool. The default name ReportX or ChartY is given for each new report or chart created in a given InfoAssist session. X and Y are numbers that start at 1 and increase by 1 for each report or chart created. For more information on switching between multiple reports, see View Tab.
Note: The File menu is not available in InfoAssist Basic.
The Design group contains commands to select the design mode for creating reports, and design preview options for accessing data. The Design group is shown in the following image.
The design preview options are:
Note: This is not available in InfoAssist Basic.
Note: This is not available in InfoAssist Basic.
The design options are:
Note: In Live Preview, an exclamation point is placed next to fields that are too large to be displayed within the space allotted. The allotted space is determined by the page-level styling. Page-level styling includes page size, orientation, margins, and font size.
There is no way to define a limit for the number of characters that will fit on a page. This limit varies by the selected page and font styling. The bigger the page size and smaller the font, the more characters that can fit.
The Filter group contains commands for creating filters. The commands are:
In the Filter dialog box, you can create simple filters using WHERE and WHERE TOTAL statements to filter your report. You can also select fields by which to filter the report and specify a value for that field. For more information, see Field Tab. For more information on creating filters, see Data Tab.
The Clipboard group contains commands that enable you to work with information that you have pasted, cut, copied, or duplicated in your document.
Note: The Clipboard group is only available in Document mode.
The Report group contains commands to enhance a report. The commands are:
You can also select a document styling theme or an application theme to style all reports created in InfoAssist. Use the Environment and Styling section of the Options window, which is accessible by clicking Options in the Application main menu.
The following image shows the Header & Footer dialog box with Report Header active.
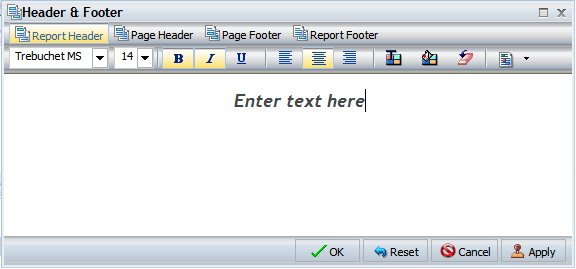
Another way to access the Header & Footer dialog box is to click the down arrow next to the Header & Footer button. It opens a drop-down menu from which you can select the heading or footing that you want to work with (Report Header, Page Header, Page Footer, Report Footer). After you make your selection, the Header & Footer dialog box opens, and the heading or footing that you selected is active.
From the Header & Footer dialog box, you can add and style the active heading or footing, or choose a different heading and footing to work with by selecting the applicable tab. You can switch among tabs, but InfoAssist does not save changes made on the tabs until you click Apply or OK. If you click Apply, the Header & Footer dialog box remains open. If you click OK, the dialog box closes.
You can style a selected heading or footing using the options on the styling toolbar. From left to right, you can customize the font type, font size, and font style (bold, italic, or underline). You can justify text (left, center, or right), select the font color and background color, and restore styling settings to their default value from the template.
You can also insert quick text into a heading or footing. Quick text is supplied for you. It includes information that is typically useful in identifying a report or chart. From the preformatted text drop-down menu, you can select:
For charts, an
icon ![]() on
the far right of the styling ribbon is enabled. This icon provides
two options for controlling the way in which the page heading and page
footing are rendered. The default option, Create Header and Footer
as text, renders the heading and footing as text elements that are
separate from the chart image. The option, Embed Header and Footer
in the chart, renders the heading and footing text as part of the
chart image.
on
the far right of the styling ribbon is enabled. This icon provides
two options for controlling the way in which the page heading and page
footing are rendered. The default option, Create Header and Footer
as text, renders the heading and footing as text elements that are
separate from the chart image. The option, Embed Header and Footer
in the chart, renders the heading and footing text as part of the
chart image.
Once you have added a heading or footing to a report or chart, you can double-click it on the canvas in design mode to reopen the Header & Footer dialog box. You can also right-click an existing heading or footing in design mode and click Edit from the menu to open the dialog box.
For more information on adding and styling headings and footings, see How to Add Headings and Footings to a Report and Formatting Page Headings and Page Footings .
The Report Style dialog box, shown in the following image, provides options to style your report.
The Report dialog box options are:
Note: The New Israeli Shekel currency symbol can be displayed with the following settings only:
Note: Reset only works while the Report Style dialog box is open. Once you click OK, all changes are committed. To undo global styling after it has been committed, you must use the Undo command on the Quick Access Toolbar.
The Color dialog box, shown in the following image, provides options for working with color in your report.
The Color dialog box options are:
| WebFOCUS |