-
Open WebFOCUS Visual Discovery Workbench Analyst
Edition (AE).
The Getting Started dialog box opens, as shown in the following image.
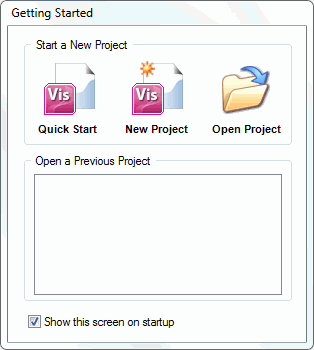
- Click New Project.
-
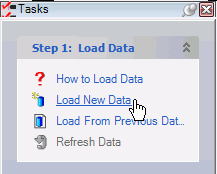
On the Tasks pane, click Load New Data,
as shown in the following image.
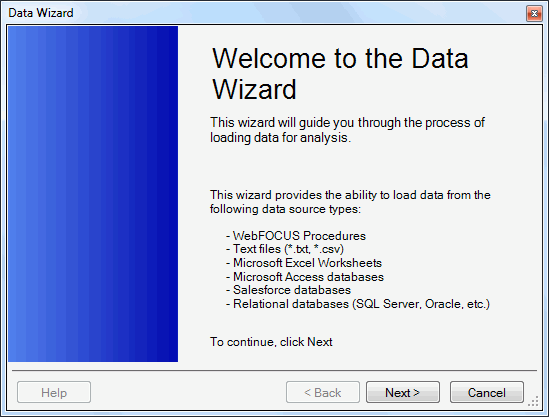
The Data Wizard opens, as shown in the following image.
-
Click Next.
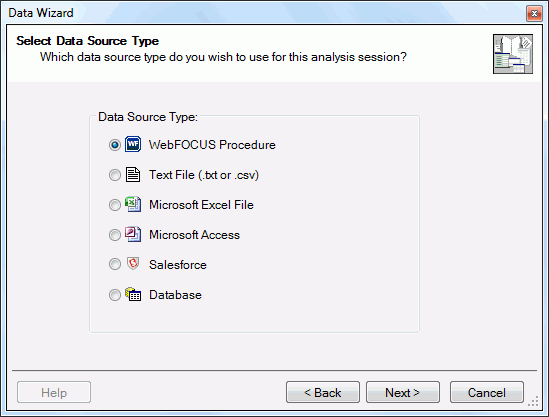
The Select Data Source Type dialog box opens, as shown in the following image.
-
Select WebFOCUS Procedure and
click Next.
Note: When using WebFOCUS procedures residing in the repository, leveraging WebFOCUS security, it is critical to use the visdisae.ibfs extension.
The Enter the WebFOCUS Procedure information dialog box opens, as shown in the following image.
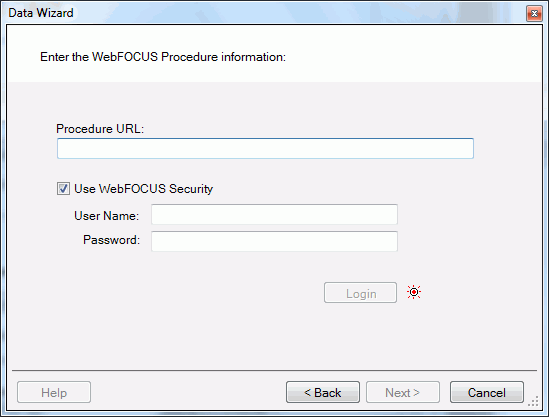
- Paste the URL of the WebFOCUS procedure, copied earlier, which points to your data.
-
Enter your WebFOCUS credentials in the User Name and
Password fields and click Login.
The red dot to the right of the Login button changes to green when your login is successful.
-
Click Next.
The Configure the Dataset wizard displays.
Two views appear on the upper-left side of the wizard (Configure View and Data View)
Configure View
By clicking Configure View, you can:
- Edit display name. To edit the display name for the table, type the new table name in the Table Name field.
-
Configure which fields to include in the dataset. Configure
specific fields to include in the dataset by checking, or clearing
the check box in the first column. If the first column of the row
is checked, then the field is already included in the dataset. If
it is not checked, then click the check box to select the field. Repeated
clicks on the check box will toggle field selection between including
in the dataset and excluding from the dataset.
Tip: Click on the first column header to select or exclude all of the fields from the dataset.
- Deselect a field for inclusion. If the first column of the row is checked, then the field is already included in the dataset. Click the check box to clear it, thus excluding the field.
-
Change field properties. To change field properties,
select the cell to be modified. For the Display Name column, type
the desired name. For the Data Type, Precision, and Currency Symbol
columns, a drop-down arrow displays to the right of the cell. Click
the drop-down arrow to display a list of options to choose from and
make a selection. For the Group Digits and As Currency columns,
click the check box to toggle the use of these options.
Tip: Click on the first column header to select or exclude all of the fields from the dataset.
Data View
By clicking the Data View you can view the data values for the first 25 rows in the dataset. This is a view-only mode to help confirm the desired dataset. This is the default view of the Configure the Dataset wizard.
-
Click Next.
The Dataset Summary dialog box opens. Review the following information:
- Source Type. WebFOCUS procedure (*.fex).
- Data Source. The name of the file.
- Source Table. The name of the file.
- Display Name. The name of the table as it will appear in WebFOCUS Visual Discovery Workbench AE.
- Rows. The number of rows of data to be loaded.
- Selected Fields. The number of fields you selected in the Configure the Dataset wizard.
-
Click Next.
Note. When you click Next, the dataset is loaded immediately and you can no longer modify the dataset properties.
Once links to WebFOCUS procedures are added to the dashboard project, connections to WebFOCUS are terminated. Therefore, when accessing the dashboard data set from the original source again (for example, opening a recent ADV file, refreshing data, reloading from the previous source, modifying, and so on), you will be prompted for each data source included.
The Loading Dataset dialog box opens, which shows the progress as data is loaded into WebFOCUS Visual Discovery Workbench AE.
The Completing Data dialog box opens, where a default data source name is included to uniquely identify this dataset.
- Click Finish.
-
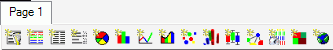
The Workspace area displays a tab with different icons,
which represent available components and charts, as shown in the
following image.
-
Click on the corresponding icons to add the following components:
- A new Pie Chart.
- A new Bar Chart.
- A new Data Sheet.
For more information about the available charts that can be added to your project, see Available Charts.
- In the Color Toolbar, change Color by from <none> to the desired field.
-
Arrange the charts according to your preferences and requirements.
To rearrange the charts, click and hold your mouse on the upper-left corner of the chart object, where the three horizontal lines are located. The cursor changes from a pointer to a cross-pointer, as shown in the following image.
- Click and drag the chart to the desired location.
-
Save the Visual Discovery AE project.
Note: WebFOCUS Visual Discovery AE projects can be saved as ADV or ADVM file types (.adv or .advm extension). ADVM files are portable, as they will include the data. Nevertheless, it is recommended that these files also be saved outside the IBI directory structure. In addition, WebFOCUS Visual Discovery Workbench AE maintains one backup copy of a project if you save over an existing one. As a result, if an error is encountered during the save process, you can rename the .backup file to .adv and retrieve the previous version.
Note: When pointing to WebFOCUS procedures, if you save WebFOCUS Visual Discovery AE projects as ADV file types (.adv extension), then a login prompt may be displayed when first opening the file.
-
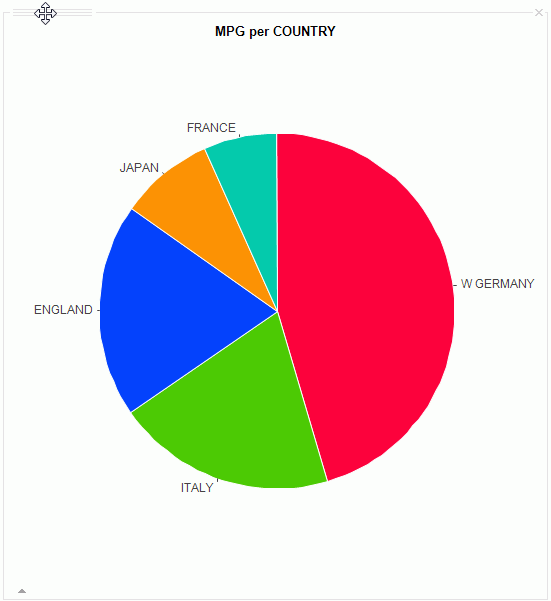
Review the project in the WebFOCUS Visual Discovery Workbench AE.
For example, select a slice in the pie chart to see how the selected slice is represented in other charts.
You are now ready to publish your Visual Discovery AE project.