The Report Library includes secure access to library content and the ability to save multiple versions of the same output. When integrating Report Library in HTML Composer, you may create a static list of values from Report Library (including all versions of that report that are currently in the library).
- Create a new HTML file, from a folder in the WebFOCUS Repository, of your Managed Reporting environment.
-
From HTML
Composer, select New Report, or New
Graph, from the Insert menu.
The cursor changes into a crosshair.
-
Drag the
crosshair to create a report or graph object and adjust it to the size
you want.
A report or graph object is created in the layout and assigned the name report(n), or graph(n), where n is a number.
-
Create an
input control to supply the Report Library content. For example,
insert a Drop Down List, List Box, Check Box, Radio Button, or Tree
Control from the Controls submenu of the Insert menu and create
the input control, adjusting it to the size you want.
Note: Only the input controls mentioned above provide options to display the content list from Report Library.
The input control object is created in the layout and assigned the name object(n), where n is a number. For example, combobox(n), listbox(n), checkbox(n), radio(n), treecontrol(n).
-
Click the Parameters tab.
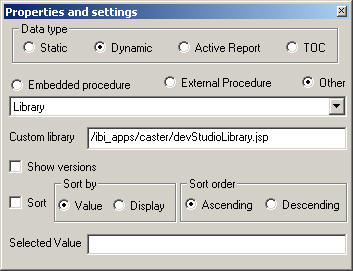
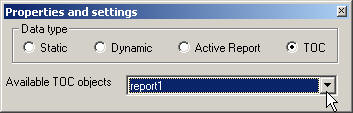
The Properties and settings dialog box appears for the control.
-
Select Static as
the Data type.
Static is selected by default.
-
Create the
Report Library values for the control.
You may create a static list of values from Report Library (including all versions of that report that are currently in the library).
-
Select Use values from Library from
the Static values drop-down list.
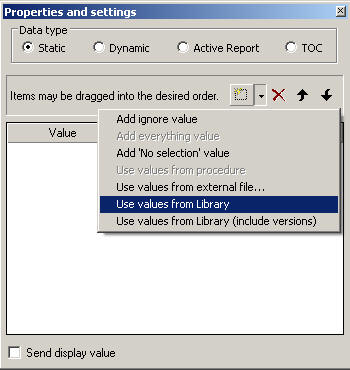
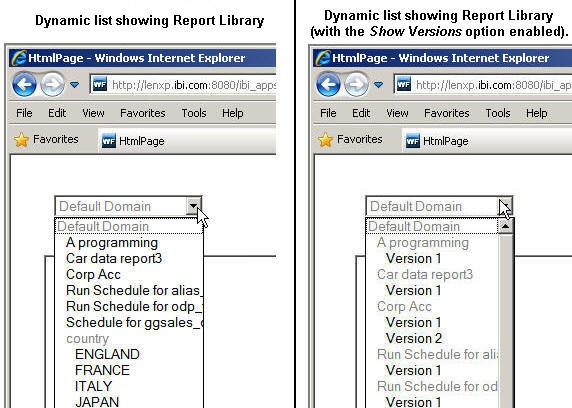
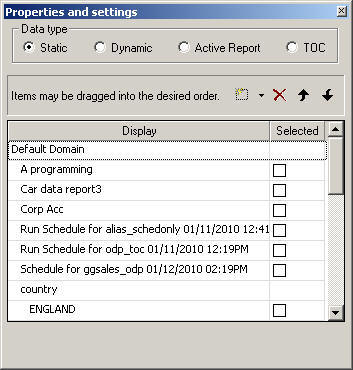
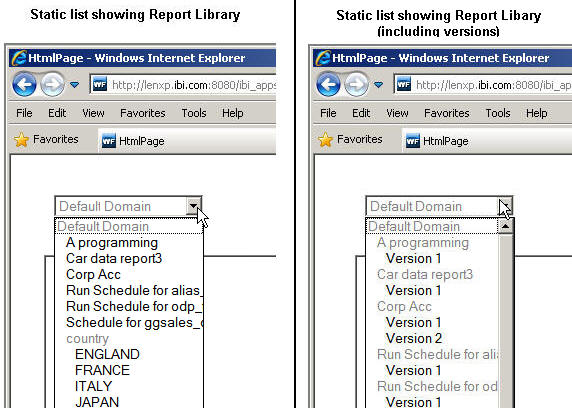
The Report Library content is retrieved in the Display column of the Properties and settings dialog box, as shown in the following image.
-
Select Use values from Library (include versions) from
the Static values drop-down list.
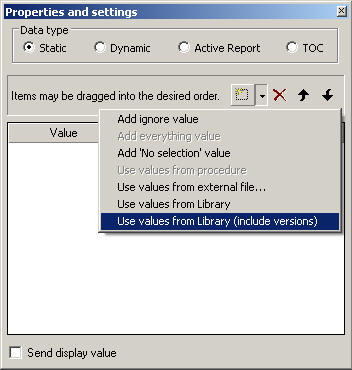
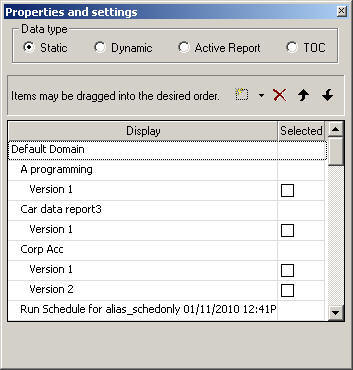
The Report Library content is retrieved in the Display column of the Properties and settings dialog box, as shown in the following image.
-
Select Use values from Library from
the Static values drop-down list.
- Optionally, you may select values and click the Delete button to eliminate any values, and use the up and down arrows to rearrange the order of the values.
- Optionally, use the Selected column to check the box for the value you want to be selected by default. More than one value can be selected.
-
Close the
Properties and settings dialog box.
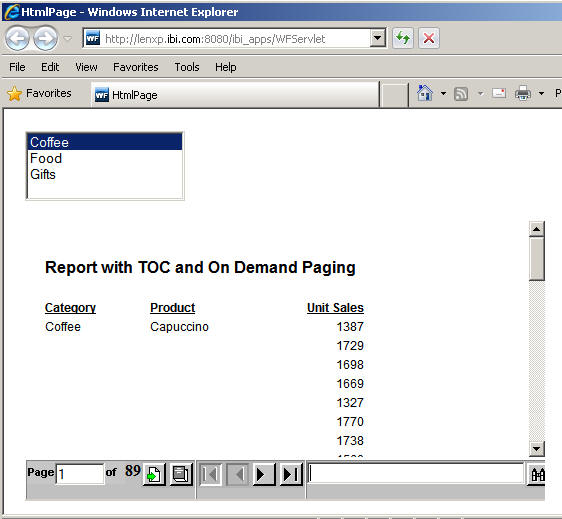
Running the HTML page shows the input control with the Report Library static list, as shown in the following image.
-
Click the Design tab
in HTML Composer and insert a hyperlink. The hyperlink obtains the
report/graph when selecting a Report Library value from the input
control.
This step requires that you create hyperlink properties. You can create hyperlink properties by inserting an image, hyperlink, button, or frame.
-
From the
Hyperlink Properties dialog box, select the Action, Source, and Target/Template
Name:
- Select Library from
the Action drop-down list.
Library only appears if a static or dynamic list of values was created for Report Library on the Parameters tab.
- Select the Source drop-down list to select the input control as the source of your Report Library content. The selected input control will be populated by the Report Library data.
- Select the Target
Type as Frame, Window, or InfoWindow for the hyperlink
output. Frame is the default selection.
The Target Type option does not appear on the Hyperlink Properties dialog box if you are inserting a frame as the hyperlink. Frame is the default target for a frame object.
- Select the Target/Template drop-down
list to select the report object for the Report Library results.
The Target/Template option does not appear on the Hyperlink Properties dialog box if inserting a frame as the hyperlink. Clicking the input control automatically populates the report at run time.
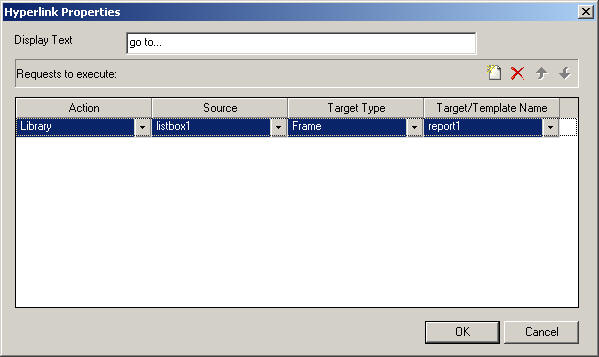
The following image shows the Hyperlink Properties dialog for a button that retrieves content from the Library and displays that content in the report1 object when clicking a value from the drop-down list.

- Click OK to close the Hyperlink Properties dialog box.
- Select Library from
the Action drop-down list.
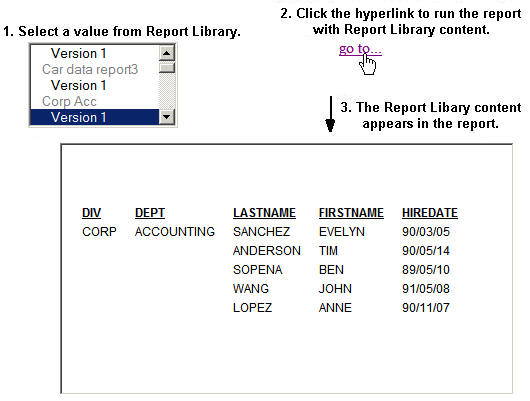
- Save and run the HTML page.
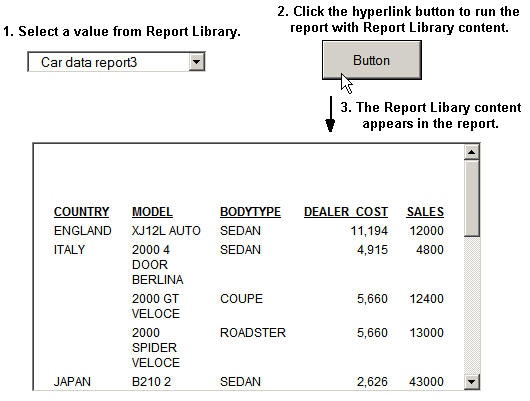
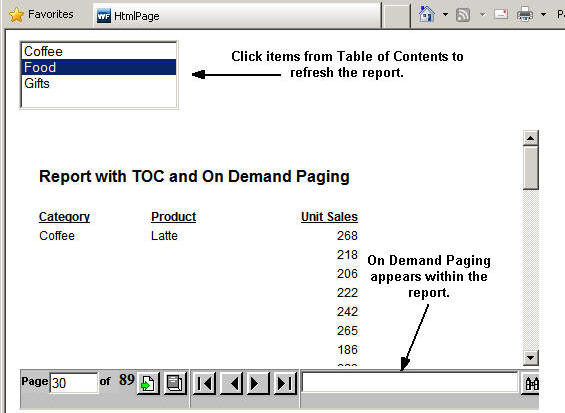
- Select a value from the Report Library and click the hyperlink to run the report. The following example shows a drop down list input control with a static list from Report Library. Clicking the hyperlink button runs the report with the selected Report Library content.