Saving, Exporting, and Sending Active Technologies Reports
You can save an active report from your browser to another
location. You can send active reports as an HTML attachment. You
can also export data in an active report to HTML, CSV (comma delimited),
or XML (Excel) formats. You can export the entire data set or only
filtered records. Export does not include the JavaScript that makes
interaction possible due to browser security settings, only static
data is exported. All data that you see in your report is exported.
For example, if you have applied calculations to a column, those calculations
appear in the exported data. In addition to exporting data, you
may also export charts created in active reports to Microsoft® Excel®,
Word®, and PowerPoint®.
The active cache feature does not support
the Save Changes and Send as E-mail options for active reports.
x
Procedure: How to Save an Active Technologies Report
In
order to save an active report, ensure that your Temporary Internet
Files setting is set to Automatic.
-
From your
browser File menu, use the Save Page As option. For example, in
Internet Explorer, select Save as.
-
In the Save
as type drop-down list, select Webpage, HTML only.
Note:
- Starting with WebFOCUS
Release 8.0 Version 01, if you have included the command SET AROUTPUT
= EXTJS in the profile or in a WebFOCUS procedure that generates
an active report or document, you cannot use the browser Save as
option to save the active report or document. Make sure to change
the command to SET AROUTPUT = ALL to allow users to save the report
or document with the Save as option. For more information on the
SET AROUTPUT command, see How to Control the Generation of the Active Technologies for HTML Output File.
- Starting with WebFOCUS
Release 8.0 Version 02, make sure that the IBIF_active_extjs parameter
is set to NO in the WebFOCUS Administration Console to use an active
report or document (format AHTML) in a fully disconnected mode that supports
the browser Save as option. You can find this parameter in the General category
of Client Settings in the Configuration menu of the WebFOCUS Administration Console.
For details on this parameter, see the WebFOCUS Security and Administration manual.
Alternatively, you can add the command SET AROUTPUT = ALL to the
WebFOCUS procedure that generates the active report or document.
x
Procedure: How to Use Save Changes in an Active Technologies Report
-
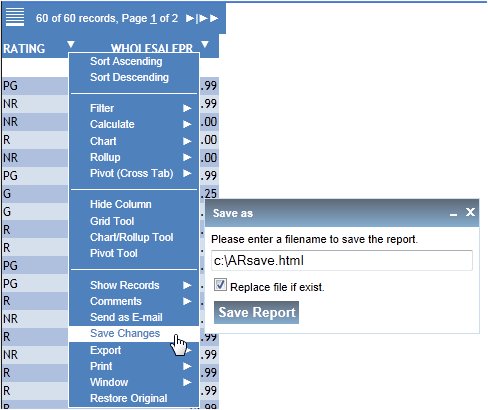
Click the
arrow in any column heading, select Save Changes.
The Prompt dialog box opens.
To
use the Save Changes option, you must enable ActiveX® in your browser security
settings.
-
If a filter
is applied to the active report, Filtered Only appears as an additional
option in the Save as dialog box.
Click Filtered Only to save only the
filtered result instead of the entire report.
-
If the active report is part
of an active dashboard, Selected Grid Only appears as an additional
option in the Save as dialog box.
Click Selected Grid Only to save only
the active report that you selected on the active dashboard instead
of the entire dashboard with multiple reports.
-
Enter a
file name and location (or keep the default) and click Save
Report.
The report is saved with the most recent modifications
applied.
The original report name does not show these modifications.
x
Procedure: How to Print Active Technologies Report Data
-
Click the
arrow in any column heading and select Print.
You can print All records or Filtered only.
-
The print
dialog menu automatically appears when selecting a print option
from active reports.
The data is sent to the printer.
x
Procedure: How to Export Data
Browsers other than Internet Explorer, such as Mozilla Firefox and Safari, do not support the
Export XML (Excel) feature of HTML active reports.
A limitation for browsers other than Internet Explorer, such as Mozilla Firefox and Safari, is the unavailability
of the export directly to Microsoft Excel function in the HTML active
report. The export directly to Microsoft Excel function in HTML
active reports requires ActiveX controls, which are supported only
when you use Internet Explorer as the web browser.
The active
report menu options Export to HTML and Export to CSV (comma delim) export
data in Unicode (UTF-16) only. Exporting data in an encoding scheme
other than Unicode is not supported. For instance, in the Save HTML
Document dialog box in Internet Explorer, you must select Unicode
from the Language drop-down list. The requirement that you export
data in Unicode applies to all platforms.
-
Click the
arrow in any column heading, select Export,
and then click the format.
Formatting is only preserved for reports that are exported
in HTML format. If you export data to HTML and then change the file
extension in the Save as dialog box to .xls, when you open the file
in Excel, it does retain all formatting.
-
Select All
Records or Filtered only.
The Save as dialog box opens.
A new browser window
also opens that shows the exported data. This data shows due to
browser security features.
-
Navigate
to a location to save the exported file, enter a name, and click Save.
-
A second
window appears in the browser when you export content to XML (Excel).
Since exporting content to Excel is done using XML, this second
window appears in the browser during the export process, which performs
a security check on the data. To prevent this second window from
appearing, give the file name an explicit Excel extension (.XLS)
in the Save dialog.
Column titles and field values for ACROSS sort fields are
not exported to CSV and XML (Excel) formats.
Field formats with
dollar signs and decimals are not exported to CSV and XML (Excel)
formats. They export as plain integers.
x
Procedure: How to Export Charts to Microsoft Excel, Word, and PowerPoint
When
you export charts, the selected application opens and a chart is
created in a new worksheet, document, or presentation. You must
use Internet Explorer as the default browser in order to successfully
export data to a Microsoft Office application.
-
Ensure that
ActiveX controls are enabled in your web browser security settings.
-
From your web browser, select Internet Options from
the Tools menu.
-
Select the Security Tab.
-
Click Custom Levels.
Ensure that ActiveX controls and plug-ins are enabled.
-
Run your
active report and create a chart.
-
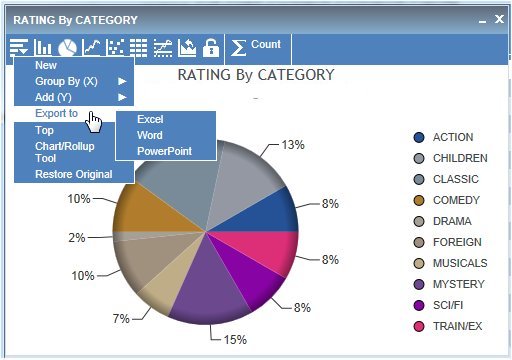
From the
chart window, select the Export To option
from the first chart icon, as shown in the following image.
-
Select Excel, Word,
or PowerPoint.
The chart is exported to the selected application.
The
chart opens in the corresponding Microsoft Office application.
The
following image is an example of a chart exported to Excel.

The
following image is an example of a chart exported to Word.
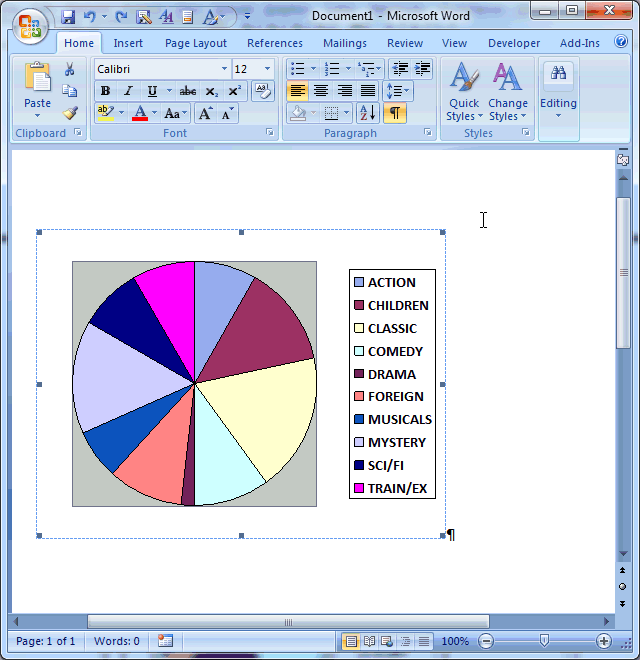
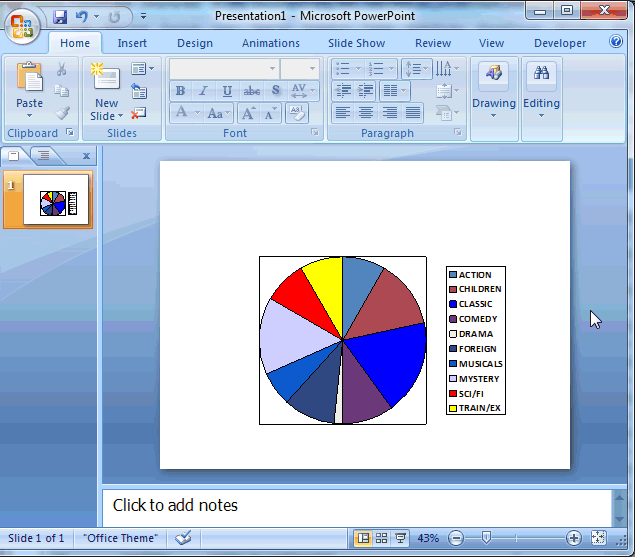
The
following image is an example of a chart exported to PowerPoint.
x
Procedure: How to Send Active Technologies Reports
You
must use Internet Explorer as the default browser in order to successfully
send active reports.
Browsers other than Internet Explorer, such as Mozilla Firefox and Safari, do not support the Send as E-mail feature of HTML active
reports.
A limitation for browsers other than Internet Explorer, such as Mozilla Firefox and Safari,
is the unavailability of Send as E-mail functions in the HTML active
report. Send as E-mail functions in HTML active reports require
ActiveX controls, which are supported only when you use Internet
Explorer as the web browser.
The
HTML file that is created by Active Technologies contains JavaScript
so that you can interact with the data in a disconnected mode. When
you send an active report or active dashboard in HTML using email,
many email client programs on a smartphone or any other mobile device
can block the JavaScript in the attachment. A third-party tool,
such as the Mobile Faves App for the iPhone or iPad, may be required
in order to correctly view the attachment.
-
Click the
arrow in the heading of a column and select Send as E-mail from
the menu.
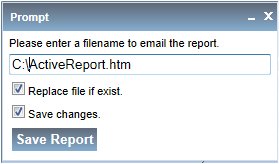
The Prompt dialog box opens.
-
If a filter
is applied to the active report, Filtered Only appears as an additional
option in the Prompt dialog box.
Click Filtered Only to send only the
filtered result instead of the entire report.
-
If the active report is part
of an active dashboard, Selected Grid Only appears as an additional
option in the Prompt dialog box.
Click Selected Grid Only to send only
the active report that you selected on the active dashboard instead
of the entire dashboard with multiple reports.
-
Enter a
file name and location (or keep the default) and click Save
Report to save the active report as a HTML document.
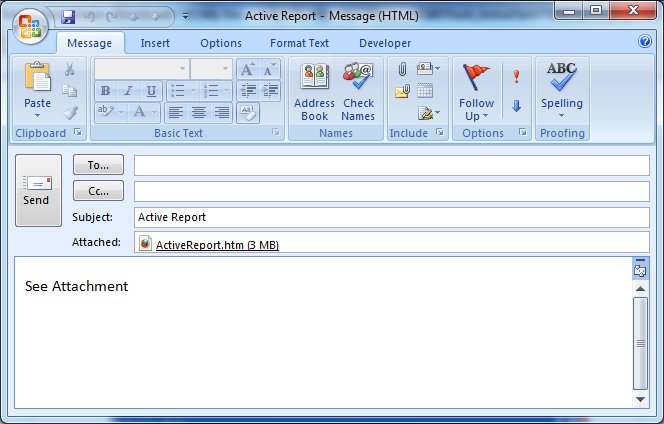
If Microsoft Outlook® is your default email system, a message
is opened with the AHTML report as an attachment.
If
Microsoft Outlook is not your default email system, save the active
report as an HTML document and attach the file to your message.
Note: When
using Internet Explorer 7 and Microsoft Office Outlook 2003 or 2007
on the Windows operating system, you may receive the error message Access
is denied if you click the attached HTML file to preview the
active report or active dashboard before
you send it. Once the email message is sent, the HTML file opens
and the active report or active dashboard appears
correctly on the machine of the email recipient.
xGenerating Images for Active Technologies Reports
You can generate images for active reports in connect
or disconnect mode by placing images in the apps directory. If images
are in the WebFOCUS Reporting Server application directory and no URL
is specified, the JPEG image converts to a JavaScript image at run time.
All resizing of images should be done outside of Developer Studio and image size should not be larger than 200x200
pixels. Embedding images does not support sizing or positioning
of the image and it uses the current size and default position for
that object. Larger images increase the time required for conversion
and the loading of the report in the browser.
There are multiple ways to generate images for active reports.
You can do one of the following, but not both.
x
Procedure: How to Place Images in the WebFOCUS Reporting Server Application
Directory for Active Technologies Reports
To place
an image in the WebFOCUS Reporting Server application
directory:
-
From the
Images tab of the Report Options dialog box, click the Browse button.
In disconnected mode, images for AHTML reports must be
JPEG images.
-
Select Developer
Studio Desktop from the Look in drop-down
list.
-
Double-click Projects
on localhost, WebFOCUS Environments,
or Windows Desktop, and navigate to the image.
-
Select the
image and click Open.
-
From the
Location drop-down list, click Page Header or Page
Footer to indicate the placement of the image in the
report.
-
Click Add.
The image is added to the image list.
-
Click OK to
apply and save your selection.
The
image is added to your apps directory and inserted into your report
at the selected location.
x
Procedure: How to Specify the Image Path for Active Technologies Reports
To
specify a full or relatively qualified URL:
-
Type a full
or relatively qualified URL path in the Image Source input field.
If no URL is specified, the JPEG image converts to a JavaScript
image at run time.
-
From the
Location drop-down list, click Page Header or Page
Footer to indicate the placement of the image in the
report.
-
Select the Include
as Reference check box.
-
Click Add to
add the image to the image list.
-
Click OK to
apply and save your selection.


