Creating an Active Technologies Report

In this section:

How to:

An active report is a self-contained report that is designed for offline analysis, meaning it contains all the data and JavaScript within the output file. Using an active report, you can:

An active report using Adobe® Flex® includes most of the capabilities available in the HTML version of active reports in a user-friendly report format. An active report delivered as a self-contained Adobe Flash file (.SWF files that are Adobe® Flash® Player compatible) allows for faster analysis of large data sets and interaction with the active report.


Top of page

x
Procedure: How to Create an Active Technologies Report
  1. With InfoAssist open in Report view, on the Format tab, in the Output Types group, click active report.
  2. Create a report.
  3. Run the report.

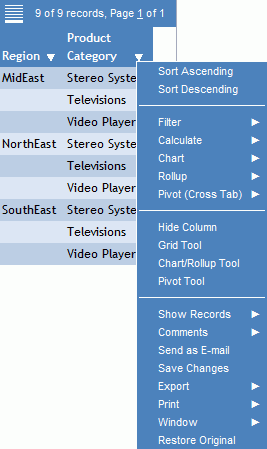
    The following image shows an active report with the available menu options for the Product Category column.

    Active Report With Active Menu of Options


Top of page

x
Active Technologies Report Menu Options

Menu options for an active report are described in the following table.

Option

Definition

Sort Ascending

Sorts the column in ascending order.

Sort Descending

Sorts the column in descending order.

Filter

Filters the data. Options are:

  • Equals
  • Not equal
  • Greater than
  • Greater than or equal to
  • Less than
  • Less than or equal to
  • Between
  • Contains
  • Contains (match case)
  • Omits
  • Omits (match case)

Calculate

Calculation types that you can apply to the column:

  • Clear
  • Clear all
  • Count
  • Count distinct, which counts the number of distinct values within a field.

For numeric fields, you can also apply:

  • Sum
  • Avg
  • Min
  • Max
  • % of Total

Chart

Creates a chart from the report. Options are Pie, Line, Bar, and Scatter.

Rollup

Lists the fields available to create a Rollup table.

Pivot (Cross Tab)

Lists the fields available to create a Pivot table.

Visualize

Adds or removes visualization bars to the selected column. The Visualize option is available for numeric data columns.

Hide Column

Suppresses the display of the selected column in the report.

Show Columns

Lists the names of the columns that are hidden in the report, allowing you to individually restore a column.

Select the name of a specific column in the hidden columns list to restore that column to the report.

Freeze Column

Freezes the report at a particular point so that columns to the left of the freeze point remain in view while the user scrolls through the other report columns.

Note: If the report can be fully viewed in the browser window, freeze is not applied. The Freeze column option is not available for expandable report (Accordion) views.

Unfreeze All

Unfreezes the columns.

Grid Tool

Opens the Grid Tool which you can use to change the column order, select multiple columns to sort ascending or descending, hide and show columns, add a calculation result to a column, and add subtotals in the active report.

Chart/Rollup Tool

Opens the Chart/Rollup Tool which you can use to select multiple group fields to generate the chart or rollup table. The Chart/Rollup Tool contains a list of columns available in the active report to add to Group By and Measure fields. Drag the columns into the field that you want.

Pivot Tool

Opens the Pivot Tool, which you can use to select multiple group fields to generate the chart or pivot table. The Pivot Tool contains a list of columns available in the active report to add to Group By, Across, and Measure fields. Drag the columns into the field that you want.

Show Records

Opens the Show Records menu option to list the number of records available for display per page in the report. Select a number (for example, 10) to display, per page. Default displays the number of records (lines) per page that is specified in the WebFOCUS report procedure.

Comments

Options to display comments under cells or hide indicators for comments in the active report output.

Send as E-mail

Sends report as email.

Note: To use this feature, you must have ActiveX enabled in your browser security settings.

This feature is only supported in Internet Explorer.

Save Changes

Saves changes.

Note: To use this feature, you must have ActiveX enabled in your browser security settings.

This feature is only supported in Internet Explorer.

Export

Exports all records or filtered only records to HTML, CSV, or XML.

Note: To use this feature, you must have ActiveX enabled in your browser security settings.

Print

Prints all records or filtered only records.

Window

Displays reports in a cascade or separate tabs.

Restore Original

Restores the active report to its default state specified in the report procedure.


x
Configuring Active Technologies Report Options

In this section:

You can configure active report options, including menu options, based on user role through the active report options dialog box.

You access the dialog box on the Format tab, in the Features group, by clicking the active report options button. The button is available when active report, active Flash, or active PDF is selected as the output type.

The active report options dialog box contains the following tabs:


x
General Tab

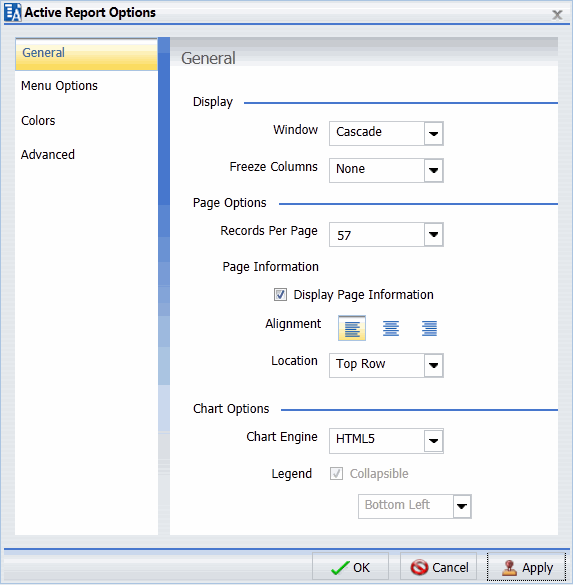
Use the General tab to set common properties specific to active reports. The General tab is shown in the following image.

The General tab contains the following options:

Display. This area contains options to set the window to cascade or tabs, and options to freeze columns.

Page Options. This area contains options to set the number of records per page, enable the display of page information, edit the alignment, and set the location of the page information.

Chart Options. This area contains options that pertain to charts.


x
Menu Options Tab

Use the Menu Options tab to select a user type and select which options to display in the menu. The Menu Options tab is shown in the following image.

Active Report Options Dialog Box Menu Options Tab

The Menu Options tab contains the following options:


x
Colors Tab

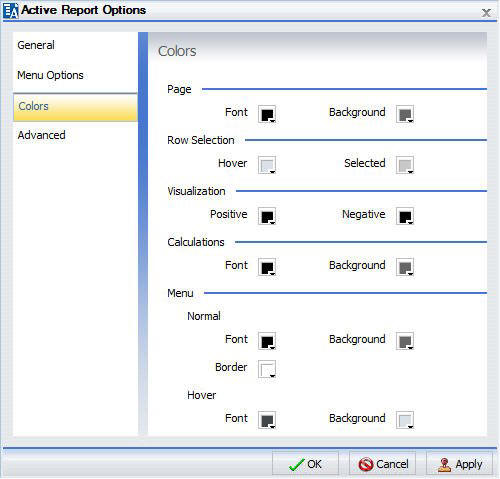
Use the Colors tab to select colors for various objects on the report. The Colors tab is shown in the following image.

Active Report Options Dialog Box Colors Tab

The Colors tab contains the following options:

Page. This area contains options to set the colors for the font and background for the page text.

Row Selection. This area contains options to set the colors that appear when you point to or select a row on the report.

Visualization. This area contains options to set the colors for the data visualization bars.

Calculations. This area contains options to set the colors for values in a calculation.

Menu. This area contains options to change the color of the menu.


x
Advanced Tab

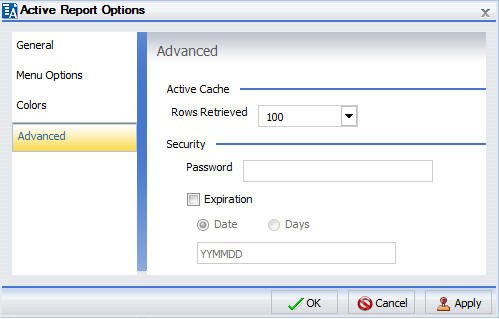
Use the Advanced tab to control the number of rows retrieved from active cache and to make security settings.

Note: active cache is enabled when you select active report as the output type on the Format tab, in the Output Types group, and click Pages on Demand on the Format tab, in the Navigation group.

The Advanced tab is shown in the following image.

Active Report Options Dialog Box Advanced Tab

The Advanced tab contains the following options:

active cache. Enables reports to cache the data in a binary file and return the data to the output window in pre-set increments.

Security. This area allows you to set a password to access the report and enable expiration by date or by days.

Note: When setting security options for active reports, be aware that security options can be set for each individual component on the canvas, but only one password can be set for the entire document.


WebFOCUS