To specify a color for the background of a report, use the following syntax within a StyleSheet.
Note that when using BACKCOLOR in a PDF report, extra space is added to the top, bottom, right, and left of each cell of data in the report. This is for readability and to prevent truncation.
TYPE=type, [subtype,] BACKCOLOR={color|RGB({r g b|#hexcolor})}, $
where:
- type
- Is the report component you wish to affect, such as REPORT, HEADING, or TITLE. In a HEADING, FOOTING, SUBHEADING, or SUBFOOTING, you can specify a background color for individual elements.
- subtype
- Is any additional attribute, such as COLUMN, ACROSS, ITEM, that is needed to identify the report component that you are formatting. In a HEADING, FOOTING, SUBHEADING, or SUBFOOTING, you can specify a background color for individual elements. See Identifying a Report Component in a WebFOCUS StyleSheet for more information about how to specify different report components.
- color
- Is the background color, which fills the space of the specified report component. The default value is NONE. If you are creating a report in HTML format, background colors will only appear in web browsers that support them.
- RGB (r g b)
- Specifies the font color using a mixture of red, green, and
blue.
(r g b) Is the desired intensity of red, green, and blue, respectively. The values are on a scale of 0 to 255, where 0 is the least intense and 255 is the most intense. Note that using the three color components in equal intensities results in shades of gray.
- RGB (#hexcolor)
- Is the hexadecimal value for the color. For example, FF0000 is the hexadecimal value for red. The hexadecimal digits can be in upper or lower case and must be preceded by a pound sign (#).
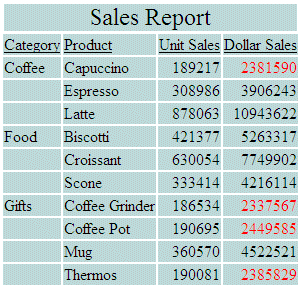
You can use color in a report to emphasize important information in a report. In the following report request, the data in the Dollar Sales column has been specified as RED on the condition that the Dollars value is less than 2,500,000. The background color is set to LIGHT BLUE:
TABLE FILE GGSALES
ON TABLE SET PAGE-NUM OFF
HEADING
"Sales Report"
SUM UNITS DOLLARS BY CATEGORY BY PRODUCT
ON TABLE SET STYLE *
TYPE=REPORT, BACKCOLOR=LIGHT BLUE, $
TYPE=DATA, COLUMN=DOLLARS, COLOR=RED, WHEN=DOLLARS LT 2500000, $
TYPE=REPORT, GRID=OFF, $
TYPE=HEADING, JUSTIFY=CENTER, SIZE=12,$
ENDSTYLE
END
The output is: