How to: |
As of Release 8.0 Version 08, you can use the ARFILTER_ONCHANGE = ON property in a compound layout report to filter a target active report or chart on an active dashboard with the values selected in chained active form controls. When the value of the first active form control in a chain changes, the report or chart is filtered with the initial value in the second and subsequent active form controls in the chain.
Add the following syntax to an OBJECT in a compound layout report
ARFILTER_ONCHANGE = {ON|OFF} where:
- ON
Filters a target active report or chart on a dashboard with the initial value in a child active form control when the value of the parent active form control changes.
- OFF
In the output of an active report or chart on a dashboard, displays data for all the possible filter values in a child active form control when the value of the parent active form control changes, whether or not the value All is displayed in the child control. Does not perform filtering of the active report or chart based on the initial value in the child active form control. This is the default setting.
The first active form control on the following sample active dashboard prompts the end user for the value of the region, and the second active form control prompts for the value of the state within the selected region. The second active form control is chained to the first active form control. The active report filters the data using the initial values in the active form controls, Midwest and IL.

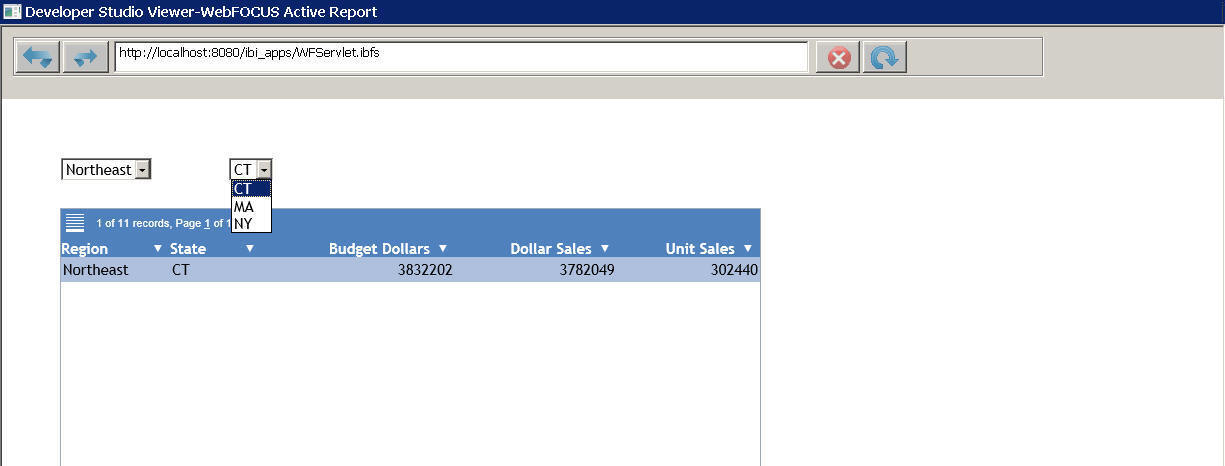
If the end user selects the value Northeast from the first active form control, the active report filters the data on the initial value of the second active form control, which is CT, as shown in the following image.

In the compound layout report that generates this output, the property ARFILTER_ONCHANGE for the first and second active form control is set to ON. The drop-down lists for the region and the state contain all possible filter values.
Chained_Filtering.fex
The compound layout report is as follows.
*-HOLD_SOURCE
SET HTMLARCHIVE=ON
COMPOUND LAYOUT PCHOLD FORMAT AHTML
UNITS=IN, $
SECTION=section1, LAYOUT=ON, METADATA='prop_with_names^Margins_Left=0.5
   ^Margins_Top=0.5^Margins_Right=0.5^Margins_Bottom=0.5^thumbnailscale=1',
   MERGE=OFF, ORIENTATION=PORTRAIT, PAGESIZE=Letter, SHOW_GLOBALFILTER=OFF,
   ARGRAPHENGINE=JSCHART, ACTIVE_UNITS=PTS, $
PAGELAYOUT=1, NAME='Page layout 1', text='Page layout 1', TOC-LEVEL=1,
   BOTTOMMARGIN=0.5, TOPMARGIN=0.5, METADATA='BOTTOMMARGIN=0.5,TOPMARGIN=0.5,
   LEFTMARGIN=0,RIGHTMARGIN=0,', $
COMPONENT='report1', TEXT='report1',
   TOC-LEVEL=2, POSITION=(0.624 1.144), DIMENSION=(7.293 3.331),
   ARREPORTSIZE=DIMENSION, METADATA='Z-INDEX: 1; POSITION: absolute;
   WIDTH: 7.293in; HEIGHT: 3.331in; TOP: 1.144in; LEFT: 0.624in', $
OBJECT=COMBOBOX, NAME='combobox1', POSITION=(0.625 0.625),
   DIMENSION=(1.542 0.188), ARFILTER_ONCHANGE=ON, ARFILTER_NAME='combobox1',
   ARDATA_REPORT='report1', ARDATA_COLUMN='REGION', ARFILTER_TARGET='report1',
   ARFILTER_CONDITION='EQ', ARFILTER_ACTIVE=ONLOAD,  $
OBJECT=COMBOBOX, NAME='combobox2', POSITION=(2.375 0.625),
DIMENSION=(1.375 0.188), ARFILTER_ONCHANGE=ON, ARFILTER_NAME='combobox2',
ARDATA_REPORT='report1', ARDATA_COLUMN='ST', ARFILTER_TARGET='report1',
ARFILTER_CONDITION='EQ', ARFILTER_ACTIVE=ONLOAD,
ARFILTER_PARENT='combobox1', $
END SET COMPONENT='report1'
-*component_type report
TABLE FILE GGSALES
SUM
GGSALES.SALES01.BUDDOLLARS
GGSALES.SALES01.DOLLARS
GGSALES.SALES01.UNITS
BY LOWEST GGSALES.SALES01.REGION
BY LOWEST GGSALES.SALES01.ST
ON TABLE SET PAGE-NUM NOLEAD
ON TABLE NOTOTAL ON TABLE PCHOLD FORMAT AHTML ON TABLE SET HTMLCSS ON ON TABLE SET STYLE * INCLUDE=ENInformationBuilders_Medium1.sty, $ TYPE=REPORT, LINES-PER-PAGE=20, $ ENDSTYLE END COMPOUND END
To display data in the target report for all the possible filter values in the second active form control, change the ARFILTER_ONCHANGE property to OFF in the OBJECT code in the preceding procedure, as follows.
OBJECT=COMBOBOX, NAME='combobox1', POSITION=(0.625 0.625),
   DIMENSION=(1.542 0.188), ARFILTER_ONCHANGE=OFF, ARFILTER_NAME='combobox1',
   ARDATA_REPORT='report1', ARDATA_COLUMN='REGION', ARFILTER_TARGET='report1',
   ARFILTER_CONDITION='EQ', ARFILTER_ACTIVE=ONLOAD,  $
OBJECT=COMBOBOX, NAME='combobox2', POSITION=(2.375 0.625),
DIMENSION=(1.375 0.188), ARFILTER_ONCHANGE=OFF, ARFILTER_NAME='combobox2',
ARDATA_REPORT='report1', ARDATA_COLUMN='ST', ARFILTER_TARGET='report1',
ARFILTER_CONDITION='EQ', ARFILTER_ACTIVE=ONLOAD,
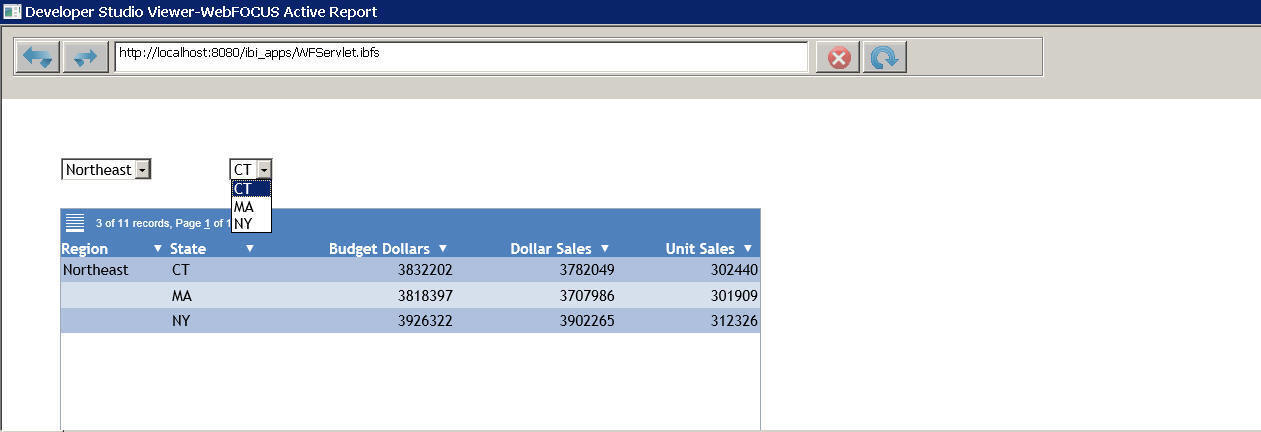
ARFILTER_PARENT='combobox1', $ The data that populates the drop-down list for the second active form control, and the data in the target report, is not filtered by the initial value in the child active form control. The value is not selected in the second active form control, and the target report displays data for all the possible filter values. This results in behavior similar to having the value All in the second active form control in a chain.
The target report shown in the following image is filtered only by the parent active form control in the chain.

