Active Technologies Enhancements

In this section:

This section describes new features for WebFOCUS Active Technologies.

WebFOCUS Active Technologies reports and dashboards provide business intelligence (BI) for any computer or mobile device running a web browser. Active Technologies present data with a variety of interactive analytic capabilities in a single portable document, deliverable to any type of mobile device. Users of rich interactive applications created with Active Technologies can easily manipulate the data, intuitively explore information, and uncover critical trends and patterns using device-specific user interface characteristics and gestures for multi-touch screens.

With Active Technologies, you can quickly develop completely portable BI applications, deliver interactive reports and dashboards to any user, and reduce the load on the database and server systems by allowing users to work in disconnected mode. The built-in analytics include sorting, filtering, performing data calculations, charting, and much more.


Top of page

x
Filtering an Active Technologies Report on a Dashboard Using Chained Form Controls

How to:

As of Release 8.0 Version 08, you can use the ARFILTER_ONCHANGE = ON property in a compound layout report to filter a target active report or chart on an active dashboard with the values selected in chained active form controls. When the value of the first active form control in a chain changes, the report or chart is filtered with the initial value in the second and subsequent active form controls in the chain.


x
Syntax: How to Filter an Active Technologies Report on a Dashboard Using Chained Form Controls

Add the following syntax to an OBJECT in a compound layout report

ARFILTER_ONCHANGE = {ON|OFF}

where:

ON

Filters a target active report or chart on a dashboard with the initial value in a child active form control when the value of the parent active form control changes.

OFF

In the output of an active report or chart on a dashboard, displays data for all the possible filter values in a child active form control when the value of the parent active form control changes, whether or not the value All is displayed in the child control. Does not perform filtering of the active report or chart based on the initial value in the child active form control. This is the default setting.


Example: Filtering an Active Technologies Report on a Dashboard Using Chained Form Controls

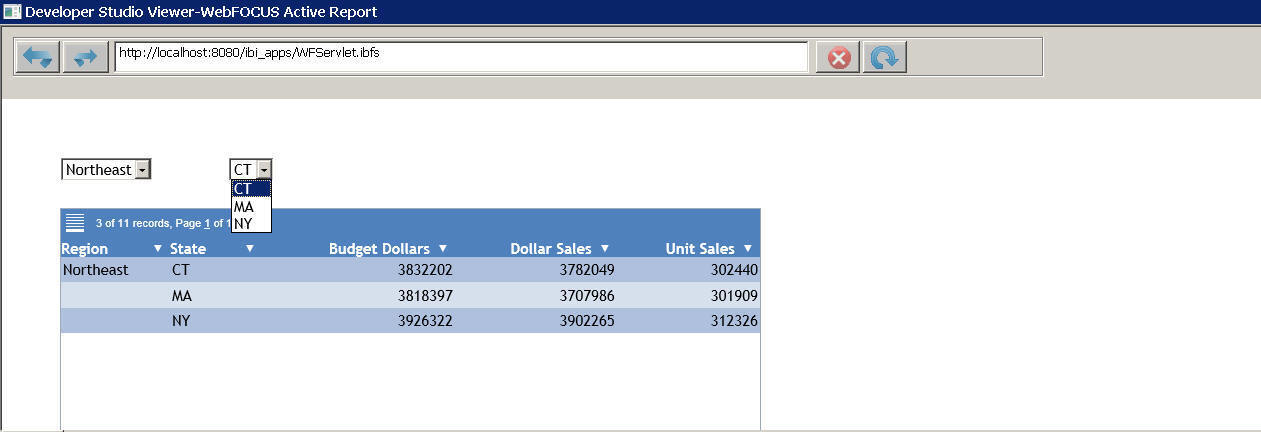
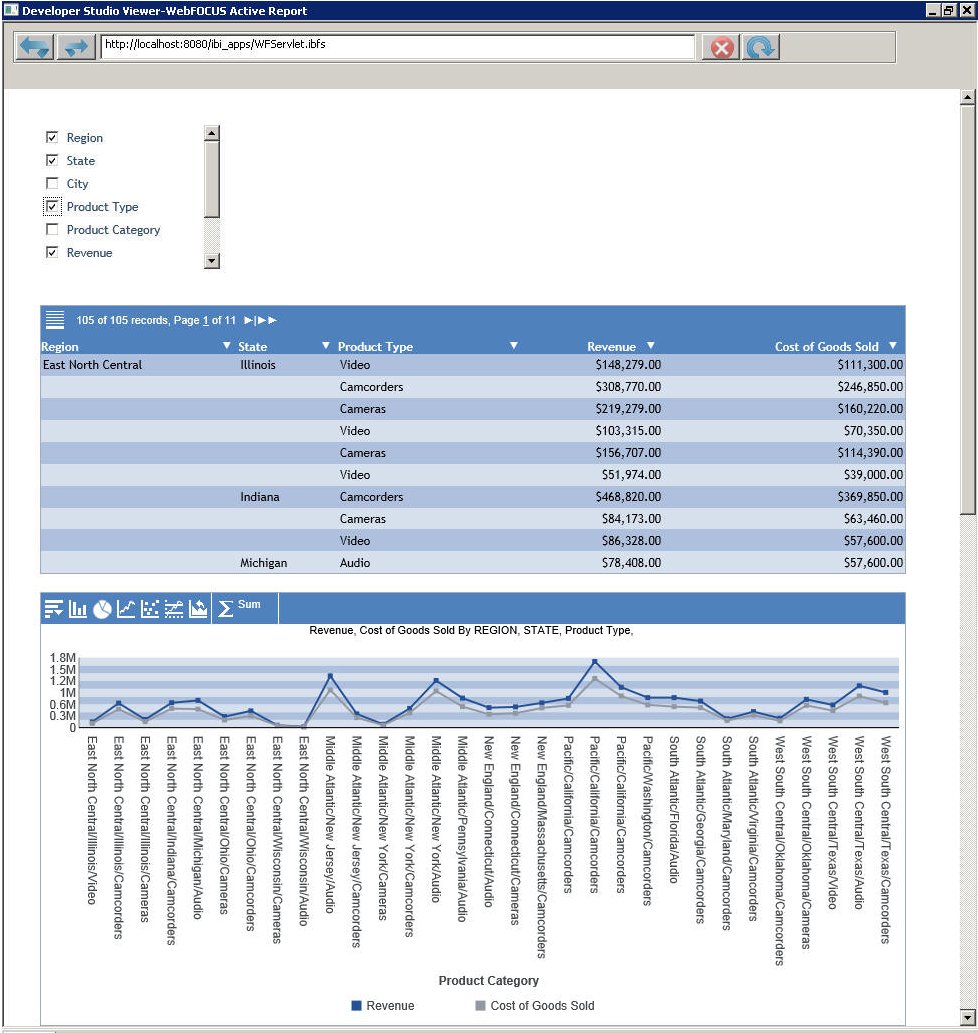
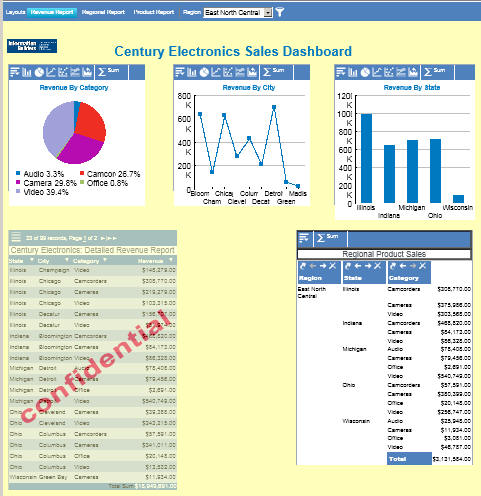
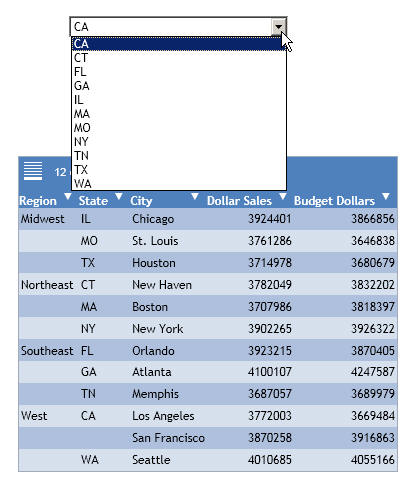
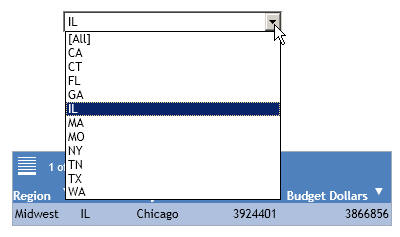
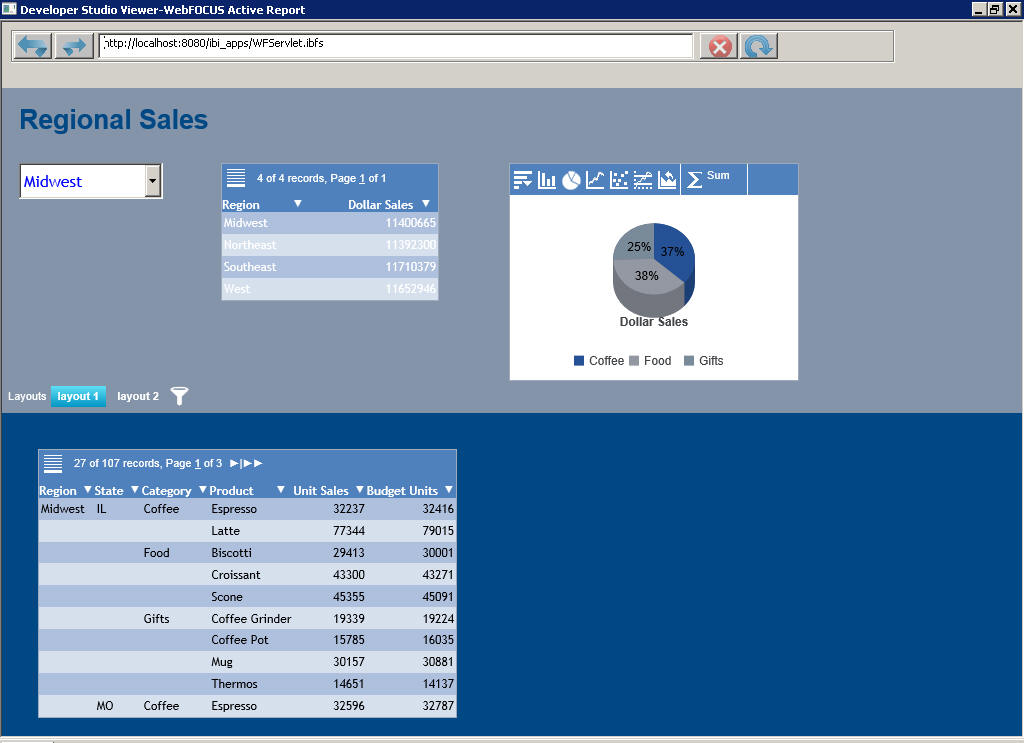
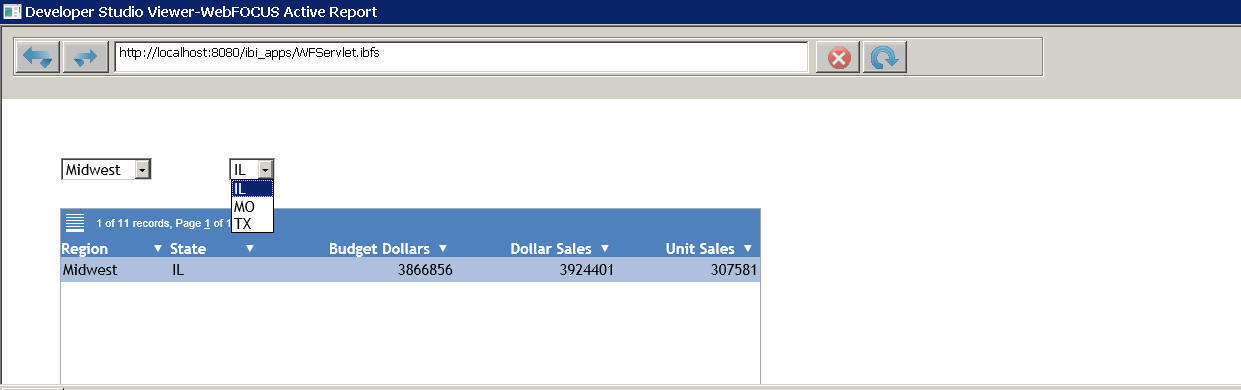
The first active form control on the following sample active dashboard prompts the end user for the value of the region, and the second active form control prompts for the value of the state within the selected region. The second active form control is chained to the first active form control. The active report filters the data using the initial values in the active form controls, Midwest and IL.

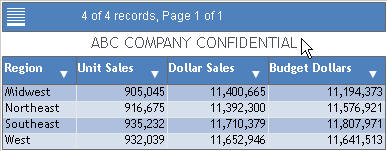
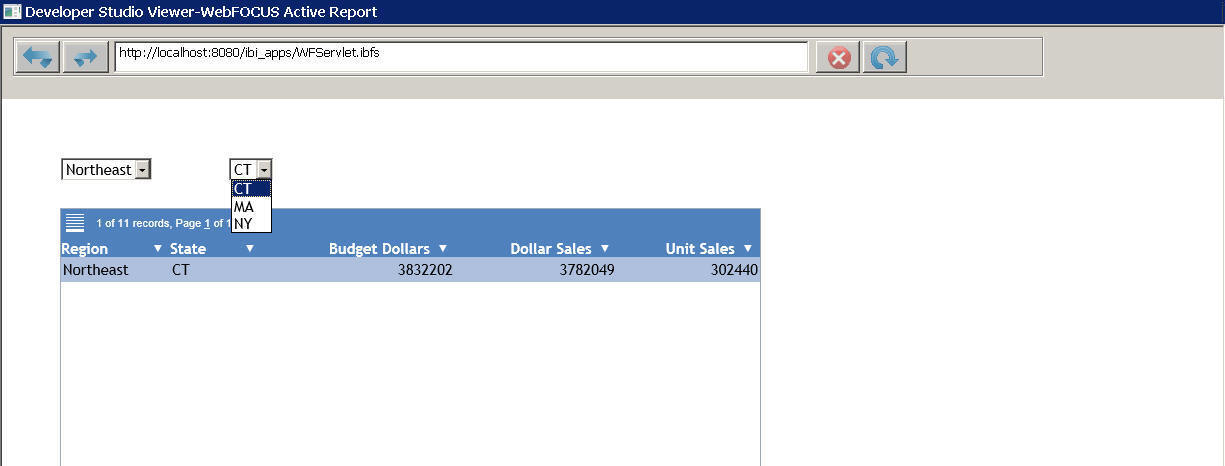
If the end user selects the value Northeast from the first active form control, the active report filters the data on the initial value of the second active form control, which is CT, as shown in the following image.

In the compound layout report that generates this output, the property ARFILTER_ONCHANGE for the first and second active form control is set to ON. The drop-down lists for the region and the state contain all possible filter values.

Chained_Filtering.fex

The compound layout report is as follows.

*-HOLD_SOURCE
SET HTMLARCHIVE=ON 
COMPOUND LAYOUT PCHOLD FORMAT AHTML 
UNITS=IN, $
SECTION=section1, LAYOUT=ON, METADATA='prop_with_names^Margins_Left=0.5
   ^Margins_Top=0.5^Margins_Right=0.5^Margins_Bottom=0.5^thumbnailscale=1', 
   MERGE=OFF, ORIENTATION=PORTRAIT, PAGESIZE=Letter, SHOW_GLOBALFILTER=OFF,
   ARGRAPHENGINE=JSCHART, ACTIVE_UNITS=PTS, $
PAGELAYOUT=1, NAME='Page layout 1', text='Page layout 1', TOC-LEVEL=1,
   BOTTOMMARGIN=0.5, TOPMARGIN=0.5, METADATA='BOTTOMMARGIN=0.5,TOPMARGIN=0.5,
   LEFTMARGIN=0,RIGHTMARGIN=0,', $ 
COMPONENT='report1', TEXT='report1',
   TOC-LEVEL=2, POSITION=(0.624 1.144), DIMENSION=(7.293 3.331),
   ARREPORTSIZE=DIMENSION, METADATA='Z-INDEX: 1; POSITION: absolute;
   WIDTH: 7.293in; HEIGHT: 3.331in; TOP: 1.144in; LEFT: 0.624in', $
OBJECT=COMBOBOX, NAME='combobox1', POSITION=(0.625 0.625),
   DIMENSION=(1.542 0.188), ARFILTER_ONCHANGE=ON, ARFILTER_NAME='combobox1',
   ARDATA_REPORT='report1', ARDATA_COLUMN='REGION', ARFILTER_TARGET='report1',
   ARFILTER_CONDITION='EQ', ARFILTER_ACTIVE=ONLOAD,  $
OBJECT=COMBOBOX, NAME='combobox2', POSITION=(2.375 0.625),
   DIMENSION=(1.375 0.188), ARFILTER_ONCHANGE=ON, ARFILTER_NAME='combobox2',
   ARDATA_REPORT='report1', ARDATA_COLUMN='ST', ARFILTER_TARGET='report1',
   ARFILTER_CONDITION='EQ', ARFILTER_ACTIVE=ONLOAD,
   ARFILTER_PARENT='combobox1',  $
END
SET COMPONENT='report1' 
-*component_type report 
TABLE FILE GGSALES 
SUM
     GGSALES.SALES01.BUDDOLLARS
     GGSALES.SALES01.DOLLARS
     GGSALES.SALES01.UNITS 
BY  LOWEST GGSALES.SALES01.REGION 
BY  LOWEST GGSALES.SALES01.ST 
ON TABLE SET PAGE-NUM NOLEAD 
ON TABLE NOTOTAL
ON TABLE PCHOLD FORMAT AHTML 
ON TABLE SET HTMLCSS ON 
ON TABLE SET STYLE * 
INCLUDE=ENInformationBuilders_Medium1.sty,
$ 
TYPE=REPORT,
   LINES-PER-PAGE=20,
$ 
ENDSTYLE 
END 
COMPOUND END

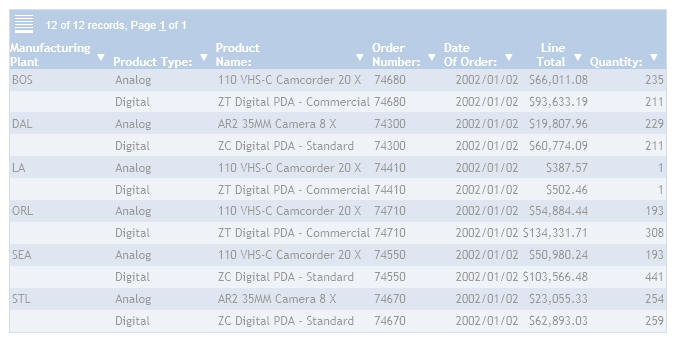
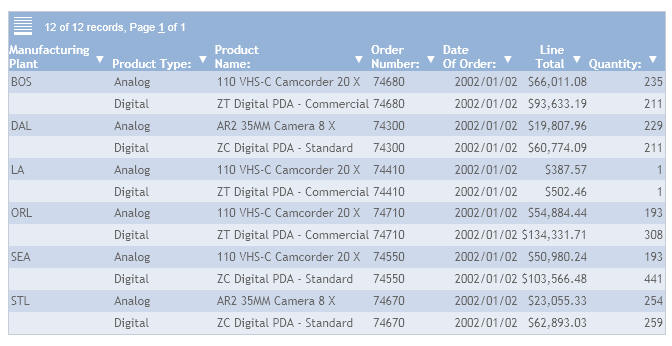
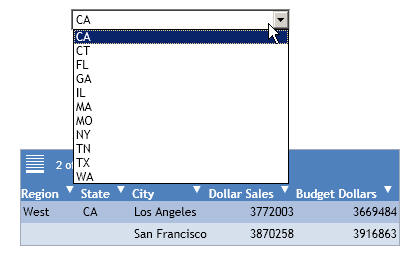
To display data in the target report for all the possible filter values in the second active form control, change the ARFILTER_ONCHANGE property to OFF in the OBJECT code in the preceding procedure, as follows.

OBJECT=COMBOBOX, NAME='combobox1', POSITION=(0.625 0.625),
   DIMENSION=(1.542 0.188), ARFILTER_ONCHANGE=OFF, ARFILTER_NAME='combobox1',
   ARDATA_REPORT='report1', ARDATA_COLUMN='REGION', ARFILTER_TARGET='report1',
   ARFILTER_CONDITION='EQ', ARFILTER_ACTIVE=ONLOAD,  $
OBJECT=COMBOBOX, NAME='combobox2', POSITION=(2.375 0.625),
   DIMENSION=(1.375 0.188), ARFILTER_ONCHANGE=OFF, ARFILTER_NAME='combobox2',
   ARDATA_REPORT='report1', ARDATA_COLUMN='ST', ARFILTER_TARGET='report1',
   ARFILTER_CONDITION='EQ', ARFILTER_ACTIVE=ONLOAD,
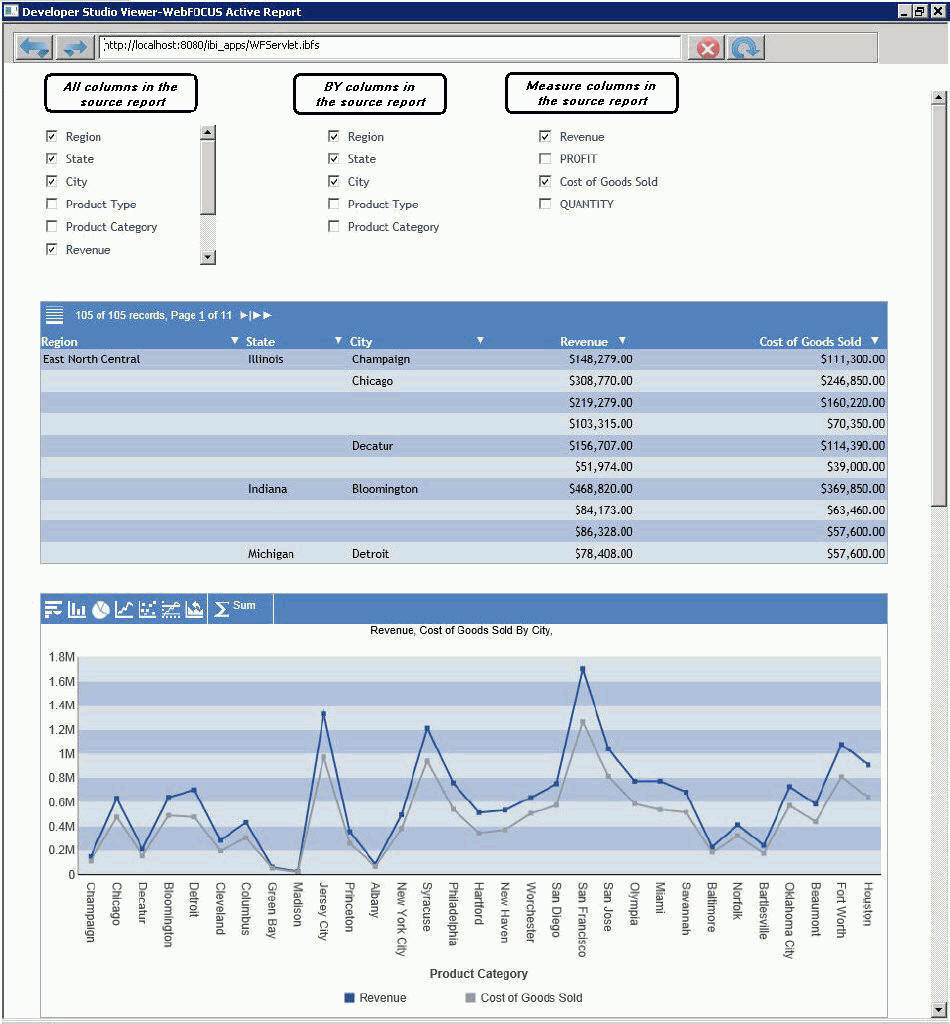
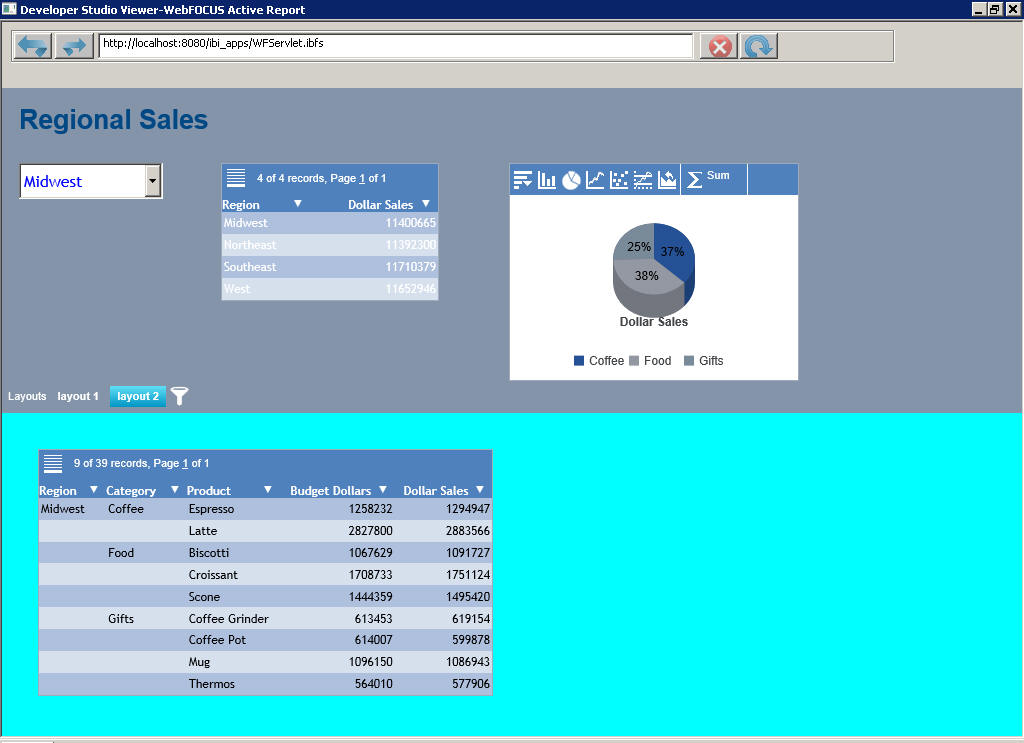
   ARFILTER_PARENT='combobox1',  $

The data that populates the drop-down list for the second active form control, and the data in the target report, is not filtered by the initial value in the child active form control. The value is not selected in the second active form control, and the target report displays data for all the possible filter values. This results in behavior similar to having the value All in the second active form control in a chain.

The target report shown in the following image is filtered only by the parent active form control in the chain.


Top of page

x
Defining Custom Styles for an Active Technologies Report or Dashboard: Chart Classes

In this section:

As of Release 8.0 Version 08, the Active Technologies .arChart class has been extended to include support for a gradient background.

For more information on custom styling, including the names of files used in its implementation, see Appendix C, Defining Custom Styles for an Active Technologies Report or Dashboard, in the Active Technologies User's Guide.


x
Chart Classes

These classes style an active chart.

Class: .arChart

Applies To: FLEX and APDF output formats. Also applies to DEFAULT, FLEX, and FUSION chart engines (ARGRAPHENGINE = DEFAULT, FLEX, or FUSION). For ARGRAPHENGINE = JSCHART, use InfoAssist to generate the chart.

Description: Defines the background style and font for an Adobe Flex chart with the FLEX or APDF output format. This class does not affect the chart style itself. It has no effect on other chart engines, except for the default chart heading area.

Example: Gradient Background

In this example, gcolor1 in the first line is a user-supplied name. The name in the second line must match the name in the first line.

".arChart":"gradientBackground:gcolor1;",
".gcolor1":[
   "gradColors:#D7A0FA,#8937CC,#2F1166;",
   "gradRatios:0,.5,1;",
   "gradAlphas:1,1,1;",
   "gradRotation:90;",
   "gradType:Linear;"
],


Top of page

x
Controlling the Generation of the Active Technologies for HTML Output File

How to:

As of Release 8.0 Version 07, the SET AROUTPUT command enables you to control how and where the Active Technologies for HTML output file is generated.

For example, because all JavaScript processing is performed in the memory of the web browser, an active report has a processing limit of approximately 5,000 records or 100 pages of output. The SET AROUTPUT = EXTJS command enables you to use external JavaScript files instead of embedding the JavaScript within the HTML output file, in order to improve performance at run time.

The SET AROUTPUT command applies to active reports with the AHTML output format.

For an example of the use of this command, see Technical Memo 4739 (TM4739), Combining an Active Technologies Dashboard With an HTML Page Using -HTMLFORM.


x
Syntax: How to Control the Generation of the Active Technologies for HTML Output File

The syntax for the command is as follows. You can add the command to the profile (edasprof.prf) or to the WebFOCUS procedure that generates the active report.

SET AROUTPUT = {EXTJS|ALL|DATALOOK}

where:

EXTJS

Uses external JavaScript files instead of embedding the JavaScript within the HTML output file.

This option generates styling structures, data structures, images, and the JavaScript that launches the active report. Active Technologies JavaScript is called using external SCRIPT tags and is downloaded from the middle tier at run time.

The EXTJS option:

  • Applies only to connected mode.
  • Requires the installation of WebFOCUS Release 8.0 Version 01 or higher.

ALL

Generates and embeds all items within the HTML output file, including Active Technologies JavaScript, styling structures, data structures, images, and the JavaScript that launches the active report. Maintains disconnected mode for an active report. ALL is the default value.

Note: Starting with WebFOCUS Release 8.0 Version 01, make sure to use the command SET AROUTPUT = ALL to allow users to save an active report or document with the browser Save as option. For more information on saving active reports and documents, see the topic Saving, Exporting, and Sending Active Technologies Reports, in Chapter 4, Using an Active Technologies Report, of the Active Technologies User's Guide.

DATALOOK

Generates styling structures and data structures. This option is similar to AHTMLTAB. The output produced is not a complete HTML active report. However, you can include the output file in another HTML document using the Dialogue Manager command -HTMLFORM. Always use this option with ACTIVEREPORTJS.

For more information on AHTMLTAB and the !IBI.OBJ.ACTIVEREPORTJS; command, see the reference section on FORMAT AHTMLTAB, in the topic Choosing Output File Formats, in Chapter 8, Saving and Reusing Your Report Output, of the Creating Reports With WebFOCUS Language manual.


Top of page

x
Using an Active Technologies Form Control to Show or Hide Columns in a Report or Chart

How to:

As of Release 8.0 Version 05, you can use a check box control to display a list of column names from a source report. At run time, end users can check the name of each column that they want to show in a target report or chart on an active dashboard, and uncheck the name of each column that they want to hide. All target reports and charts that contain columns from the list are updated with the choice of columns as end users check and uncheck names.

The following is a list of column names in a sample check box control.

When you run an active dashboard for the first time, a NOPRINT or hidden column in a report or chart component on the dashboard is not displayed in the report or chart output. If that report or chart component is the source report for a check box control, the NOPRINT or hidden column is unchecked (deselected) in the corresponding check box by default.

A check box for all other columns in the source report is initially checked (selected) by default.

The list of column names in a check box control uses the field name or title specified in the Master File for the data source. If the source report uses an AS phrase to specify the column title, that title is used in the list.

This feature applies to an active dashboard with output format AHTML. It does not support the use of ACROSS column names.


x
Syntax: How to Use an Active Technologies Form Control to Show or Hide Columns in a Report or Chart
The syntax is
COMPOUND LAYOUT PCHOLD FORMAT AHTML
.
.
.
OBJECT=CHECKBOX,. . .
ARDATA_REPORT='name_of_source_report',
ARDATA_COLUMN='{@@COLUMNS|@@BYS|@@MEASURES}',
ARFILTER_TARGET=’target_report_name1,target_report_name2,...',
.
.
.

where:

COMPOUND LAYOUT PCHOLD FORMAT AHTML

Indicates the supported output format for an active dashboard. The use of a check box control to show or hide columns in a report is available for a compound layout report with output format AHTML.

OBJECT=CHECKBOX

Adds a check box control to an active dashboard.

ARDATA_REPORT='name_of_source_report'

Is the name of the source report containing the column names that populate the check box control on an active dashboard.

This property is required for the check box control, as described in this feature.

ARDATA_COLUMN='{@@COLUMNS|@@BYS|@@MEASURES}'

Indicates which set of column names is included in the check box control on an active dashboard. The available options are:

  • @@COLUMNS displays a list of all the columns in the source report.
  • @@BYS displays a list of all the sort columns in the source report, specified using a BY command.
  • @@MEASURES displays a list of all the measure columns in the source report, specified using a PRINT or SUM command.

This property is required for the check box control, as described in this feature.

ARFILTER_TARGET=’target_report_name1,target_report_name2,...’

Is the name of the target report or chart that is updated by the choice of column names made in the check box control. You can update multiple reports and charts with the end user choices. To update multiple components, provide a list of component names, separating each name with a comma (,).

This property is required for the check box control, as described in this feature.

For details on OBJECT syntax, see the information on configuring active form controls with WebFOCUS syntax in the Active Technologies User's Guide.


Example: Using a Check Box Control to Show or Hide Columns in a Report and Chart

The following sample code creates three check box controls, each with a set of column names used to show or hide columns in a report and chart on an active dashboard.

All three types of check box controls are shown for the purpose of illustration. In a real application, you would typically include the first set only (all columns in the source report), the second set only (all BY columns in the source report), the third set only (all measure columns in the source report), or any combination of these sets.

COMPOUND LAYOUT PCHOLD FORMAT AHTML 
UNITS=IN,SHOW_GLOBALFILTER=OFF, $ 
SECTION=section1, LAYOUT=ON, ORIENTATION=PORTRAIT, PAGESIZE=Letter, $ 
PAGELAYOUT=1, NAME='Page layout 1', text='Page layout 1', $ 
COMPONENT='report1', TEXT='report1', POSITION=(0.5 3),
   DIMENSION=(12 2), $ 
COMPONENT='graph1', TEXT='graph1', POSITION=(0.5 7.5),
   DIMENSION=(12 6), $ 
OBJECT=CHECKBOX, NAME='object1',COLOR=RGB(53 78 109), FONT='ARIAL',
   ARFILTER_TARGET='report1,graph1', ARDATA_COLUMN='@@COLUMNS',
   ARDATA_REPORT='report1', POSITION=(.5 .5), DIMENSION=(2.5 2), $ 
OBJECT=CHECKBOX, NAME='object2',COLOR=RGB(53 78 109), FONT='ARIAL',
   ARFILTER_TARGET='report1,graph1', ARDATA_COLUMN='@@BYS',
   ARDATA_REPORT='report1', POSITION=(4.5 .5), DIMENSION=(2 2), $ 
OBJECT=CHECKBOX, NAME='object3',COLOR=RGB(53 78 109), FONT='ARIAL',
   ARFILTER_TARGET='report1,graph1', ARDATA_COLUMN='@@MEASURES',
   ARDATA_REPORT='report1', POSITION=(7.5 .5), DIMENSION=(2 2), $ 
END 
SET COMPONENT='report1' 
TABLE FILE CENTURYSALES 
SUM LINEPRICE AS 'Revenue' 
PROFIT NOPRINT 
COSTOFGOODSSOLD 
QUANTITY NOPRINT 
BY REGION 
BY STATE 
BY CITY 
BY PRODUCTTYPE 
BY PRODUCTCATEGORY 
WHERE CENTURYSALES.ORDERS.YEAR EQ '2006'; 
WHERE CENTURYSALES.STORESEG.COUNTRY EQ 'United States'; 
WHERE CENTURYSALES.STORESEG.REGION EQ 'Middle Atlantic' OR
   'Pacific' OR 'South Atlantic' OR 'New England' OR
   'East North Central' OR 'West South Central'; 
WHERE CENTURYSALES.PRODSEG.PRODUCTCATEGORY EQ 'Audio Systems'
   OR 'DVD' OR 'DVD Camcorders' OR 'Digital Cameras' OR
   'Organizers' OR 'TV'; 
WHERE RECORDLIMIT EQ 200; 
ON TABLE SET ARGRAPHENGINE JSCHART 
ON TABLE PCHOLD FORMAT AHTML 
ON TABLE SET STYLE * 
INCLUDE = ENInformationBuilders_Medium1, $ 
TYPE=REPORT, LINES-PER-PAGE=10, $ 
TYPE=REPORT, COLUMN=N4, HIDE=ON, $ 
TYPE=REPORT, COLUMN=N5, HIDE=ON, $ 
ENDSTYLE 
END 
SET COMPONENT='graph1' 
GRAPH FILE CENTURYSALES 
SUM LINEPRICE AS 'Revenue' 
PROFIT NOPRINT 
COSTOFGOODSSOLD 
QUANTITY NOPRINT 
BY REGION NOPRINT 
BY STATE NOPRINT 
BY CITY 
BY PRODUCTTYPE 
BY PRODUCTCATEGORY 
WHERE CENTURYSALES.ORDERS.YEAR EQ '2006'; 
WHERE CENTURYSALES.STORESEG.COUNTRY EQ 'United States'; 
WHERE CENTURYSALES.STORESEG.REGION EQ 'Middle Atlantic' OR
   'Pacific' OR 'South Atlantic' OR 'New England' OR
   'East North Central' OR 'West South Central'; 
WHERE CENTURYSALES.PRODSEG.PRODUCTCATEGORY EQ 'Audio Systems'
   OR 'DVD' OR 'DVD Camcorders' OR 'Digital Cameras' OR
   'Organizers' OR 'TV'; 
WHERE RECORDLIMIT EQ 200; 
ON GRAPH SET ARGRAPHENGINE JSCHART 
ON GRAPH PCHOLD FORMAT AHTML 
ON GRAPH SET LOOKGRAPH VLINE 
ON TABLE SET STYLE * 
INCLUDE = ENInformationBuilders_Medium1, $ 
TYPE=REPORT, LINES-PER-PAGE=20, $ 
TYPE=REPORT, COLUMN=N4, HIDE=ON, $ 
TYPE=REPORT, COLUMN=N5, HIDE=ON, $ 
ENDSTYLE 
END 
COMPOUND END

When you run the compound layout report, the following output is displayed.

On the sample active dashboard:

Notice that a check box in the first and third set of column names displays the column title Revenue, as specified by the AS phrase in the source report (SUM LINEPRICE AS 'Revenue').

The check boxes for Product Type, Product Category, PROFIT, and QUANTITY are initially deselected because these columns are hidden in the source report.

Note: Product Type and Product Category are hidden using the HIDE=ON WebFOCUS StyleSheet setting to preserve the column titles specified in the Master File, whereas PROFIT and QUANTITY are NOPRINT columns in the source report, resulting in the display of the actual field names.

You can now make a choice of columns to display in the target report and chart specified in the following property:

ARFILTER_TARGET='report1,graph1'

For example, to hide the column City in the target report and chart, deselect the check box for City in the full set of column names. The column City is removed from the report and chart on the active dashboard.

To show the column Product Type in the target report and chart, select the check box for Product Type in the full set of column names. The column Product Type is now shown in the report and chart on the active dashboard.

The updated report and chart reflecting your choices are shown in the following image.


Top of page

x
Viewing Data as a Chart

As of Release 8.0 Version 02, when you run an active report on an iPad, you can tap Chart or touch the right arrow for the Chart menu option to display a menu that specifies the default value for the type of chart that will be displayed and the default aggregation (calculation) that will be used to draw the chart. Also listed are the columns that are available for display on the X-axis of the chart (the Group By columns).

The following image shows a sample Chart menu. In this example, the default chart type is Bar and the default aggregation is Sum, for the selected numeric data column. Columns that can be displayed on the X-axis (Group By columns) are listed on the menu.

You can access the same menu from the Advanced Chart icon at the bottom of the screen if you are already in a chart in full-screen web app view. This menu and icon apply to ARGRAPHENGINE=JSCHART.

Tap a Group By column for the X-axis to automatically generate a chart that is the result of the default values and the selected X-axis column. The chart is displayed in tab view, with a new Chart tab appended after the Report tab and any other existing tabs.

The chart is generated in full-screen web app view by default, if you are in that view.

Alternatively, you can tap the Chart Type menu to change the chart type or tap the Aggregation drop-down menu to change the calculation type, before selecting the Group By column to generate the new chart.

Tapping the Chart Type menu displays the Chart Type options, as shown in the following image.

You can now tap a category, such as Pie, and then tap the Donut chart type that will be used to display the chart. The following image shows some of the charts in the Pie category.

If you are using the WebFOCUS Mobile Faves for iOS app, it may take a moment for the chart types in a chart category to be displayed. There is no JavaScript engine that renders JavaScript faster inside the iOS app, and JavaScript cannot take advantage of features such as hardware acceleration.

On the new Chart tab, you can change the values to customize the chart for your reporting needs. You can also manipulate the way that you present the data.


Top of page

x
Setting the ALPHA Background Color of an Active Technologies Report

How to:

As of Release 8.0 Version 02, you can set the ALPHA background color of an active report or chart, and each report or chart object on an active dashboard, so that the color is transparent. The ALPHA background color includes the background color of the data in the report or chart, and alternating background colors. This capability enables you to place an image in the background of a report or chart. For example, you can add a watermark behind a report.

This feature applies to all Active Technologies output formats (AHTML, FLEX, and APDF).

In the remainder of this topic, the terminology active report or report includes active chart.

In the following example, the ALPHA background color of the tabular report on the left of the active dashboard is set so that the color is transparent. The image of the message confidential is placed in the background of the tabular report.


x
Syntax: How to Set the ALPHA Background Color in a TABLE or GRAPH Request

For a stand-alone active report, use the following WebFOCUS StyleSheet syntax

ON {TABLE|GRAPH} SET STYLE *
TYPE=REPORT, ALPHA=alpha,$
TYPE=REPORT, OBJECT=IMAGE, IMAGE=image_file, POSITION=(x y),$

where:

alpha

Is a value from 0 to 100. It controls the transparency of the background color of the report.

image_file

Is the name of the image file that you want to place in the background of the report. The image may be a watermark. GIF, JPG, and PNG image formats are supported.

x

Is the position of the image from the left edge of the report, in the units of measurement set for the report (for example, inches, centimeters, or points). You can set the units of measurement for a report using the UNITS keyword in your WebFOCUS code or using a graphical tool, such as Report Painter or InfoAssist. For more information, see the applicable reporting language and reporting tools manuals.

y

Is the position of the image from the top edge of the report, in the units of measurement set for the report.

The following example sets the ALPHA background color of an active report to 50.

ON TABLE SET STYLE *
TYPE=REPORT, ALPHA=50,$
TYPE=REPORT, OBJECT=IMAGE, IMAGE=confidential.png, POSITION=(1 1),$


x
Syntax: How to Set the ALPHA Background Color in a COMPOUND Request

For a COMPOUND request, use the following syntax

COMPONENT='name_of_report',
.
.
.
ALPHA=alpha,$

where:

name_of_report

Is the name of the report.

alpha

Is a value from 0 to 100. It controls the transparency of the background color of the report.

An example is:

COMPONENT='report1', TEXT='report1', TOC-LEVEL=2, POSITION=(1.250 0.522),
DIMENSION=(6.250 5.525), METADATA='Z-INDEX: 100; POSITION: absolute;
WIDTH: 6.25in; HEIGHT: 5.525in; TOP: 0.522in; LEFT: 1.25in', ALPHA=50,$
OBJECT=IMAGE, NAME='watermark', IMAGE=confidential.png,
POSITION=(2.186 1.454), DIMENSION=(8.150 6.150), METADATA='Z-INDEX: 100;
POSITION: absolute; WIDTH: 4.15in; HEIGHT: 3.15in; TOP: 1.454in;
LEFT: 2.186in',$

The following two examples show the varying transparency generated from different values of ALPHA. In the first example, the value of ALPHA is 40.

In the next example, the value of ALPHA is 60.


Top of page

x
Displaying the Heading in a Rollup Table

How to:

As of Release 8.0 Version 02, when using a rollup table generated from a tabular active report, you can either display the heading that is supplied by Active Technologies or display a custom heading that you supply in the original tabular report procedure.


x
Syntax: How to Display the Heading in a Rollup Table

Use the following WebFOCUS StyleSheet syntax

ON TABLE SET STYLE *
TYPE=REPORT, ARDEFAULTHEAD={GENERATED|ORIGINAL},$

where:

GENERATED

In the rollup table, this setting displays the heading that is supplied by Active Technologies, whether or not a custom heading is supplied in the original tabular report procedure.

If you do not supply a custom heading in the original tabular report procedure, and you do not include the ARDEFAULTHEAD attribute in the procedure, ARDEFAULTHEAD defaults to GENERATED.

ORIGINAL

If you supply a custom heading in the original tabular report procedure, this setting displays the custom heading in the rollup table. If you do not supply a custom heading in the original tabular report procedure, this setting displays the heading supplied by Active Technologies.

If you supply a custom heading in the original tabular report procedure, but you do not include the ARDEFAULTHEAD attribute in the procedure, the rollup table automatically displays the custom heading, that is, ARDEFAULTHEAD defaults to ORIGINAL. To display the heading supplied by Active Technologies, you must specify ARDEFAULTHEAD=GENERATED.


Example: Displaying the Heading Supplied by Active Technologies

Consider the following tabular report procedure:

TABLE FILE GGSALES
SUM UNITS DOLLARS BUDDOLLARS
BY REGION
HEADING
"ABC COMPANY CONFIDENTIAL"
ON TABLE PCHOLD FORMAT FLEX
ON TABLE SET STYLE *
.
.
.
ENDSTYLE
END

In this example, the procedure contains a custom heading, ABC COMPANY CONFIDENTIAL. ARDEFAULTHEAD is not included in the WebFOCUS StyleSheet code. By default, the tabular report and the rollup table display the custom heading from the tabular report procedure, as shown in the following two images.

The tabular report is:

By default, the rollup table generated from the tabular report is:

To display the heading supplied by Active Technologies in the rollup table, you must add ARDEFAULTHEAD=GENERATED to the tabular report procedure:

TABLE FILE GGSALES
SUM UNITS DOLLARS BUDDOLLARS
BY REGION
HEADING
"ABC COMPANY CONFIDENTIAL"
ON TABLE PCHOLD FORMAT FLEX
ON TABLE SET STYLE *
TYPE=REPORT, ARDEFAULTHEAD=GENERATED,$
ENDSTYLE
END

The following is the rollup table generated from the tabular report:


Top of page

x
Setting the Default Filter Value for a Column on an Active Technologies Dashboard

How to:

As of Release 8.0 Version 02, you can set the default filter value in an active form control and automatically apply the filter to the data in the report and chart objects on an active dashboard at run time. This capability is implemented as an optional property for an active form control.


x
Syntax: How to Set the Default Filter Value for a Column on an Active Technologies Dashboard

The syntax is

ARFILTER_ACTIVE={ONLOAD|'"alpha_value"'|'numeric_value'}

where:

ONLOAD

Works as follows:

  • In the COMPOUND LAYOUT code for an active form control, ARFILTER_ACTIVE=ONLOAD is not set, and ARFILTER_SHOWALL=OFF.

    When you are using InfoAssist, you can create a report for an active dashboard with an active form control. Deselect the Include All check box (ARFILTER_SHOWALL=OFF) in the Active Dashboard Properties dialog box.

    For example, ARFILTER_SHOWALL=OFF is included in the following code for a drop-down list (COMBOBOX) on an active dashboard. ARFILTER_ACTIVE=ONLOAD is not set.

    OBJECT=COMBOBOX, NAME='combobox1', POSITION=(2.604 1.042),
       DIMENSION=(2.292 0.229), ARFILTER_NAME='combobox1',
       ARDATA_REPORT='report1', ARDATA_COLUMN='ST',
       ARFILTER_TARGET='report1', ARFILTER_SHOWALL=OFF, $

    In the output, the drop-down list displays the default value CA (the first value in the list) for the State column. However, on the first execution, the data in the tabular report is not filtered by CA. Instead, the tabular report displays all the data, as shown in the following image.

    Note on default behavior:

    If ARFILTER_ACTIVE is not explicitly set by default, an active form control on a dashboard does not work as intended at initial run time. On the first execution, all data is returned to the report and chart objects on the dashboard, regardless of the value that is displayed in the active form control. In addition, the report data does not necessarily correspond to the value displayed in the active form control. On subsequent executions, the report data is filtered by the value selected in the active form control.

  • In the COMPOUND LAYOUT code for an active form control, ARFILTER_ACTIVE=ONLOAD and ARFILTER_SHOWALL=OFF.

    When ARFILTER_ACTIVE=ONLOAD is set, the report data at run time is filtered by the first selection value in the particular active form control that is set.

    For example, ARFILTER_ACTIVE=ONLOAD and ARFILTER_SHOWALL=OFF are included in the following code for a drop-down list (COMBOBOX) on an active dashboard:

    OBJECT=COMBOBOX, NAME='combobox1', POSITION=(2.604 1.042),
      DIMENSION=(2.292 0.229), ARFILTER_NAME='combobox1',
      ARDATA_REPORT='report1', ARDATA_COLUMN='ST',
      ARFILTER_TARGET='report1', ARFILTER_SHOWALL=OFF,
      ARFILTER_ACTIVE=ONLOAD, $

    In the output, the drop-down list displays the default value CA (the first value in the list) for the State column. The data in the tabular report is filtered by CA, as shown in the following image.

'"alpha_value"'

Is the default filter value that you specify for display in an active form control for an alphabetic column. All data in the report and chart objects on the dashboard is automatically filtered at run time, based on the alpha_value.

For example, ARFILTER_ACTIVE='"IL"' and ARFILTER_SHOWALL=ON are included in the following code for a drop-down list (COMBOBOX) on an active dashboard:

OBJECT=COMBOBOX, NAME='combobox1', POSITION=(2.604 1.042),
  DIMENSION=(2.292 0.229), ARFILTER_NAME='combobox1',
  ARDATA_REPORT='report1', ARDATA_COLUMN='ST',
  ARFILTER_TARGET='report1', ARFILTER_SHOWALL=ON,
  ARFILTER_ACTIVE='"IL"', $ 

In the output, the drop-down list displays the default value IL for the State column. The data in the tabular report is filtered by IL, as shown in the following image.

You can specify more than one default value when ARFILTER_MULTIPLE is set to ON for a list control or check box control.

If you specify more than one alpha_value, use the syntax:

'"alpha_value1","alpha_value2",...'
'numeric_value'

Is the default filter value that you specify for display in an active form control for a numeric column. All data in the report and chart objects on the dashboard is automatically filtered at run time, based on the numeric_value.

You can specify more than one default value when ARFILTER_MULTIPLE is set to ON for a list control or check box control.

If you specify more than one numeric_value, use the syntax:

'numeric_value1,numeric_value2,...'

Top of page

x
Hiding a Report Object on an Active Technologies Dashboard

How to:

As of Release 8.0 Version 02, you can hide an active report object on an active dashboard. For example, when you want to display non-data related objects in the first tab of the dashboard and place report and chart objects in the subsequent tabs, you can hide the first report object using HIDDEN=ON syntax in your WebFOCUS code.

The data from the hidden report is still available for use in the global filter or other filter control.


x
Syntax: How to Hide a Report Object on an Active Technologies Dashboard

The syntax is

HIDDEN={ON|OFF}

where:

ON
Hides the active report object on the active dashboard.
OFF
Displays the active report object on the active dashboard. This is the default value.


Example: Hiding a Report Object on an Active Technologies Dashboard

The following sample COMPONENT declaration in the COMPOUND LAYOUT code hides the entire active report object, component R0, on the active dashboard. You can still use the data from the hidden report in the global filter or other filter control.

COMPONENT=R0, TYPE=REPORT, POSITION=(0 0), HIDDEN=ON,$

Top of page

x
Creating a Heading Area With Controls Using the Dashboard Bar

In this section:

How to:

As of Release 8.0 Version 02, you can create a heading area for an active dashboard by adding a page layout for the dashboard bar (PAGELAYOUT=DASHBOARDBAR). On the page for the dashboard bar, you can insert Active Technologies form controls, reports, and charts that are always displayed above the dashboard tabs.

This feature is available for a compound layout report with output format AHTML, FLEX, or APDF.

You can create a maximum of one page layout for the dashboard bar. Though you can place multiple components on the full page, we recommend that you avoid large reports and charts. If the page for the dashboard bar contains large reports and charts, it may fill up the entire visible area of the browser or monitor, and the heading area for the dashboard may appear bigger than the dashboard itself. This effect reduces the usability of the dashboard.


x
Design Requirements

To create a heading area for an active dashboard, you must have one report component inside the page layout for the dashboard bar. You can optionally hide this report component. For more information on this feature, see Hiding a Report Object on an Active Technologies Dashboard.

By default, Document Composer generates the syntax for an empty report when you create an active dashboard.


x
Syntax: How to Create a Heading Area With Controls Using the Dashboard Bar

The following syntax shows the PAGELAYOUT definition for DASHBOARDBAR in a section in a compound layout report. It includes a required report component, which in turn can be followed by other components and objects.

For details on the syntax used in Document Composer to create a compound layout report, see the Creating Reports With WebFOCUS Language manual.

Use the following syntax

COMPOUND LAYOUT PCHOLD FORMAT output_format 
SECTION=section_name, LAYOUT=ON, MERGE={AUTO|OFF},
   ARGRAPHENGINE=chart_engine...,$
PAGELAYOUT=DASHBOARDBAR,$
COMPONENT=component_name, TYPE=REPORT, POSITION=(x y),
   HIDDEN={ON|OFF}...,$
.
.
.
END
COMPOUND END

where:

output_format

Is AHTML, FLEX, or APDF.

section_name

Is a unique identifier for the section. It can be up to 16 characters long.

LAYOUT=ON

Specifies that the section uses a complex layout. LAYOUT=ON is the only available option at this time.

MERGE={AUTO|OFF}

Enables you to choose one of two options supported by the Active Technologies output formats. The default value is OFF. For more information on the use of this attribute, see the Active Technologies User's Guide.

chart_engine

Is any chart engine, for example, JSCHART.

PAGELAYOUT=DASHBOARDBAR

Must be DASHBOARDBAR.

component_name

Is a unique identifier for the report component that is required inside the page layout. It is the name of a report that appears later in the request. The component name can be up to 16 characters long.

TYPE=REPORT

Is the type of component. REPORT is the only supported value.

x y

Is the (x y) coordinate on the page where the upper-left corner of the component is placed. All coordinates are in current UNITs (the default value is inches), and (0 0) is the upper-left corner of the physical page.

HIDDEN={ON|OFF}

Either hides the active report component on the active dashboard (ON), or displays the active report component on the active dashboard (OFF). The default value is OFF.

Note: In the preceding syntax, ellipses (...) indicate that you can include other valid attributes.


Example: Creating a Heading Area With Controls Using the Dashboard Bar

The following code creates a heading area for an active dashboard.

COMPOUND LAYOUT PCHOLD FORMAT AHTML 
SECTION=S1, LAYOUT=ON, MERGE=OFF, ARGRAPHENGINE=JSCHART,
   ARSTYLESET=bipsilver, ARICONSET=WHITE,$ 
PAGELAYOUT=DASHBOARDBAR,$
COMPONENT=R0, TYPE=REPORT, POSITION=(3 1), DIMENSION=(3 2),$ 
COMPONENT=G0, TYPE=REPORT, POSITION=(7 1), DIMENSION=(4 3),$
OBJECT=STRING, NAME=Text_1, POSITION=(0.2 0.2), TEXT='Regional Sales',
   FONT='ARIAL', SIZE=20, COLOR=RGB(0 72 132), WRAP=OFF,
   DIMENSION=(4.270833 0.71875),$
OBJECT=COMBOBOX, NAME='object6', COLOR='blue', SIZE=12, FONT=ARIAL,
   ARFILTER_SHOWALL=OFF, ARFILTER_TARGET='R1,R2,G0',
   ARDATA_COLUMN=REGION, ARDATA_REPORT=R0, ARFILTER_CONDITION=EQ,
   POSITION=(0.2 1), DIMENSION=(2 .5), ARFILTER_ACTIVE=ONLOAD,$
PAGELAYOUT=1, TEXT=layout 1, BACKCOLOR=RGB(0 72 132),$
COMPONENT=R1, TYPE=REPORT, POSITION=(.5 .5), DIMENSION=(4.2 4),$
PAGELAYOUT=2, TEXT=layout 2, BACKCOLOR='aqua',$
COMPONENT=R2, TYPE=REPORT, POSITION=(.5 .5), DIMENSION=(6.3 4),$
END
SET COMPONENT=R0
TABLE FILE GGSALES
SUM DOLLARS
BY REGION
ON TABLE SET STYLE *
INCLUDE = ENInformationBuilders_Medium1,$
ENDSTYLE
END
SET COMPONENT=G0
GRAPH FILE GGSALES
SUM DOLLARS
BY REGION
BY CATEGORY
ON GRAPH SET LOOKGRAPH PIE
ON GRAPH PCHOLD FORMAT AHTML
ON TABLE SET STYLE *
INCLUDE = ENInformationBuilders_Medium1,$
TYPE=REPORT,
     COLUMN=N1,
     HIDE=ON,
$
ENDSTYLE
END
SET COMPONENT=R1
TABLE FILE GGSALES
SUM UNITS BUDUNITS
BY REGION
BY ST
BY CATEGORY
BY PRODUCT
ON TABLE SET STYLE *
INCLUDE = ENInformationBuilders_Medium1,$
TYPE=REPORT,
     LINES-PER-PAGE=10,
$
ENDSTYLE
END
SET COMPONENT=R2
TABLE FILE GGSALES
SUM BUDDOLLARS DOLLARS
BY REGION
BY CATEGORY
BY PRODUCT
ON TABLE SET STYLE *
INCLUDE = ENInformationBuilders_Medium1,$
ENDSTYLE
END 
COMPOUND END

When you run the compound layout report, the output that is generated is shown in the images that follow.

The heading area for the active dashboard is at the top of the window. A tabular active report on the dashboard is in the lower half of the window, on a navy background.

The heading area for the active dashboard contains an active chart, a tabular active report, and a drop-down list for filtering the data on the dashboard.

The filter from the drop-down list is applied to the components associated with this active form control, namely, the active chart at the top and the tabular active report in the lower half of the window.

The heading area for the active dashboard remains above all the tabs on the dashboard. As shown in the following image, the filter from the drop-down list in the heading area is also applied to the tabular active report on the second tab of the dashboard to broaden the scope of data analysis.


Top of page

x
Defining Custom Styles for an Active Technologies Report or Dashboard: Message Classes and Mobile Tab Classes

In this section:

As of Release 8.0 Version 02, there are two new Active Technologies classes for styling an active report or dashboard: .arLoadingMessage and .arMobileTabBar.

For more information on custom styling, including the names of files used in its implementation, see Appendix C, Defining Custom Styles for an Active Technologies Report or Dashboard, in the Active Technologies User's Guide.


x
Message Classes

These classes style the message text that is displayed for an end user.

Class: .arLoadingMessage

Applies To: AHTML

Description: Defines the font style of the Loading message text for an AHTML report or dashboard.

There is no equivalent option in a WebFOCUS StyleSheet to overwrite this class.

Example:

".arLoadingMessage":[ 
   "font-family:Helvetica;",
   "font-weight:bold;",
   "color:red;",
   "font-size:18pt;"
],


x
Mobile Tab Classes

These classes style the tabs in Active Technologies for mobile web apps.

Class: .arMobileTabBar

Applies To: AHTML

Description: Defines the background color of the tab area in Active Technologies for mobile web apps. The default background color is white. AHTML supports gradient CSS style syntax for most browsers, except for earlier releases of Internet Explorer.

There is no equivalent option in a WebFOCUS StyleSheet to overwrite this class.

Example:

".arMobileTabBar":[
   "font-family:Helvetica;",
   "background-color:yellow;"
],


WebFOCUS