Data Requirements for Different Graph Types
Regardless of the data import method, data will be interpreted
differently based on the selected graph type. The following table
shows the data values that are required for each graph type.
|
GraphType
|
Required Data Values per Row (Series)
|
|---|
|
3D (0...16)
|
One value per marker.
|
|
2D (17...54)
|
One value per marker.
|
|
Pie (55...60)
|
One value per marker.
|
|
XY Scatter (61...62)
|
Two values per marker, X and Y, in that order.
|
|
XY Scatter with Labels (63...64)
|
Three values per maker, X, Y, and text label, in
that order. Each XY point is discreetly labeled.
|
|
Polar (65...66)
|
Two values per marker in the following order:
X (degree) and Y (distance from the center).
|
|
Radar (67...69)
|
One value per marker.
|
|
Candle: Open/High/Low/Close (70)
|
Four values per marker: Open, High, Low, and
Close, in that order.
|
|
Candle: Open/High/Low/Close/Volume (71)
|
Five values per marker: Open, High, Low, Close,
and Volume.
|
|
Candle: Open/Close (72)
|
Two values per marker: Open and Close.
|
|
Stock: High/ Low (73...75)
|
Two values per marker: High and Low.
|
|
Stock: High/Low/Close (76...78)
|
Three values per marker: High, Low, and Close.
|
|
Stock: Open/High/Low/Close (79...81)
|
Four values per marker: Open, High, Low, and
Close.
|
|
Stock: High/Low/Volume (82)
|
Three values per marker: High, Low, and Volume.
|
|
Stock: Open/High/Low/Close/Volume (83)
|
Five values per marker: Open, High, Low, Close,
and Volume.
|
|
Candle: Open/Close/Volume (84)
|
Three values per marker: Open, Close, and Volume.
|
|
Histogram (85...86)
|
One value per marker.
|
|
Spectral Map (87)
|
One value per marker.
|
|
Stock: High/Low/Close/ Volume (88)
|
Four values per marker: High, Low, Close, and
Volume.
|
|
Bubble Graph (89)
|
Three values per marker: X, Y, and Z, in
that order.
|
|
Bubble Graph with Labels (90)
|
Four values per marker: X, Y, Z, and text label,
in that order.
|
|
Bubble Graph Dual-Axes (91)
|
Three values per marker: X, Y, and Z, in
that order.
|
|
Bubble Graph with Labels Dual-Axis (92)
|
Four values per marker: X, Y, Z, and text label,
in that order.
|
|
Waterfall (100...101)
|
One value per marker.
|
|
Pareto (102)
|
One value per marker.
|
|
Multi-Y (103...105)
|
One value per marker.
|
|
Funnel (106)
|
One value for each series/section of the funnel.
Only one group is shown in a funnel graph.
|
|
Gauge (110)
|
One value per gauge.
|
Note:
- If your application
does not supply the correct number of values for each data point
in your graph, you may receive the message "Not enough data to draw
chart". If you are using setData() to define values, make sure you
use setDataRangeToExtent() after the last setData() method to apply
all data values to the graph.
- Clustered Bar,
Stacked Bar, Line, and Scatter graphs may use a time scale axis. See Time Scale Axis Graphs for
special data requirements for defining a time scale axis.
x
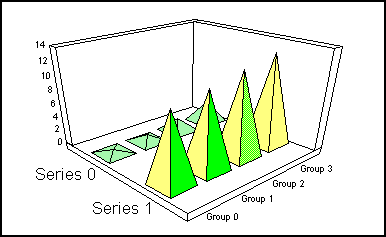
A 3D graph requires one value for each series/group.
The following sample program creates a 3D pyramid graph with two
series and four groups.
setGraphType(1);
setData(0,0,.5);
setData(0,1,1);
setData(0,2,2);
setData(0,3,3);
setData(1,0,10);
setData(1,1,11);
setData(1,2,12);
setData(1,3,13);
setDataRangeToExtent();
setSeriesLabel(0,"Series 0");
setSeriesLabel(1,"Series 1");
setGroupLabel(0,"Group 0");
setGroupLabel(1,"Group 1");
setGroupLabel(2,"Group 2");
setGroupLabel(3,"Group 3");
xData in a Bar/Line/Area Graph
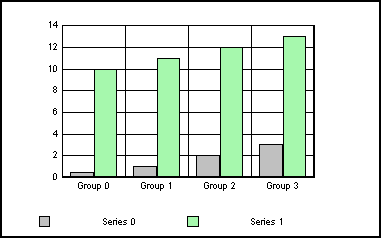
The following sample program creates a vertical bar
graph with two series and four groups.
setDepthRadius(0);
setData(0,0,.5);
setData(0,1,1);
setData(0,2,2);
setData(0,3,3);
setData(1,0,10);
setData(1,1,11);
setData(1,2,12);
setData(1,3,13);
setDataRangeToExtent();
setSeriesLabel(0,"Series 0");
setSeriesLabel(1,"Series 1");
setGroupLabel(0,"Group 0");
setGroupLabel(1,"Group 1");
setGroupLabel(2,"Group 2");
setGroupLabel(3,"Group 3");
This data produces a vertical bar graph in the following format:
x
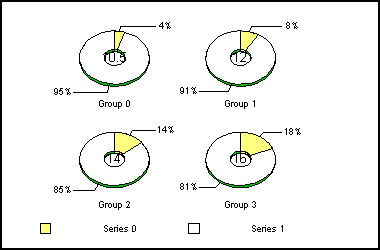
The following data is the same as the sample data that
was used to define the vertical bar graph in Data in a Bar/Line/Area Graph except
a multiple ring pie graph is selected. In pie graphs, each series
defines a slice in the pie and each group defines a pie.
setGraphType(58);
setData(0,0,.5);
setData(0,1,1);
setData(0,2,2);
setData(0,3,3);
setData(1,0,10);
setData(1,1,11);
setData(1,2,12);
setData(1,3,13);
setDataRangeToExtent();
setSeriesLabel(0,"Series 0");
setSeriesLabel(1,"Series 1");
setGroupLabel(0,"Group 0");
setGroupLabel(1,"Group 1");
setGroupLabel(2,"Group 2");
setGroupLabel(3,"Group 3");
When this data is used to define a pie graph, the graph is displayed
in the following format:
xData in an XY Scatter Graph
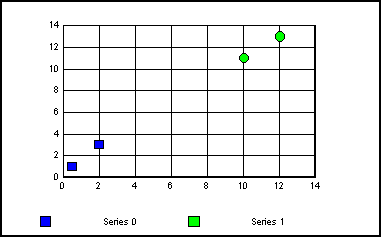
An XY scatter graph requires two values per marker,
X and Y in that order.
setGraphType(61);
setMarkerSizeDefault(60);
setData(0,0,.5);
setData(0,1,1);
setData(0,2,2);
setData(0,3,3);
setData(1,0,10);
setData(1,1,11);
setData(1,2,12);
setData(1,3,13);
setDataRangeToExtent();
setSeriesLabel(0,"Series 0");
setSeriesLabel(1,"Series 1");
Since there are eight setData() statements in the example code,
four markers are drawn in the scatter graph.
xData in an XY Scatter Graph With Labels
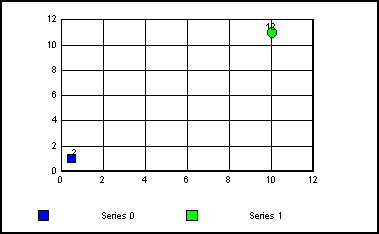
An XY scatter graph with labels requires three values
per marker, X, Y, and the text label, in that order.
setGraphType(63);
setMarkerSizeDefault(60);
setData(0,0,.5); /* X Value */
setData(0,1,1); /* Y Value */
setData(0,2,2); /* Label */
setData(1,0,10); /* X Value */
setData(1,1,11); /* Y Value */
setData(1,2,12); /* Label */
setDataRangeToExtent();
setSeriesLabel(0,"Series 0");
setSeriesLabel(1,"Series 1");
x
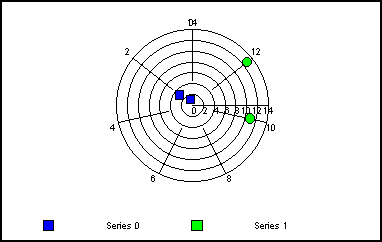
A polar graph requires two values per marker in the
following order: X (degree) and Y (distance from center).
setGraphType(65);
setMarkerSizeDefault(60);
setData(0,0,.5);
setData(0,1,1);
setData(0,2,2);
setData(0,3,3);
setData(1,0,10);
setData(1,1,11);
setData(1,2,12);
setData(1,3,13);
setDataRangeToExtent();
setSeriesLabel(0,"Series 0");
setSeriesLabel(1,"Series 1");
x
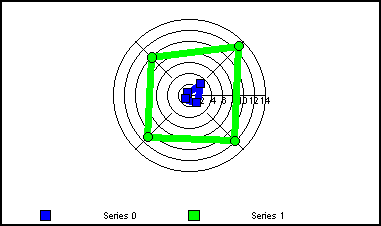
A radar graph requires one value per marker to be drawn
in the graph.
setGraphType(67);
setMarkerSizeDefault(60);
setData(0,0,.5);
setData(0,1,1);
setData(0,2,2);
setData(0,3,3);
setData(1,0,10);
setData(1,1,11);
setData(1,2,12);
setData(1,3,13);
setDataRangeToExtent();
setSeriesLabel(0,"Series 0");
setSeriesLabel(1,"Series 1");
x
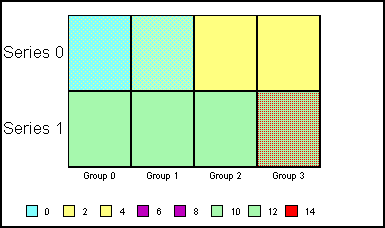
A spectral map requires one value for each cell to be
drawn in the map.
setGraphType(87);
setData(0,0,.5);
setData(0,1,1);
setData(0,2,2);
setData(0,3,3);
setData(1,0,10);
setData(1,1,11);
setData(1,2,12);
setData(1,3,13);
setDataRangeToExtent();
setSeriesLabel(0,"Series 0");
setSeriesLabel(1,"Series 1");
setGroupLabel(0,"Group 0");
setGroupLabel(1,"Group 1");
setGroupLabel(2,"Group 2");
setGroupLabel(3,"Group 3");
When this data is used to define a spectral map, the graph is
displayed in the following format:
x
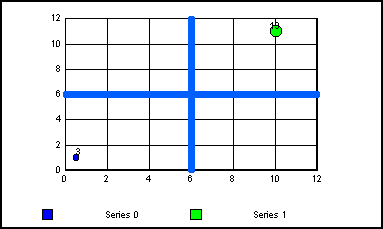
A bubble graph with labels (GraphType 92) requires four
values per marker: X, Y, Z, and text label.
setGraphType(92);
setMarkerSizeDefault(60);
setData(0,0,.5); /* X Value */
setData(0,1,1); /* Y Value */
setData(0,2,2); /* Z Value */
setData(0,3,3); /* Text Label */
setData(1,0,10); /* X Value */
setData(1,1,11); /* Y Value */
setData(1,2,12); /* Z Value */
setData(1,3,13); /* Text Label */
setDataRangeToExtent();
setSeriesLabel(0,"Series 0");
setSeriesLabel(1,"Series 1");
When this data is used to define a bubble graph, the graph is
displayed in the following format:
x
A funnel graph is basically a pie graph that shows only
one group of data at a time. The series in the group are stacked
in the funnel with the first series at the top and the last series
at the bottom. Since the funnel graph shows only one group of data
at a time, the data that defines the graph should include multiple
rows (series) and one column (group). If a data set includes multiple
columns (groups), you can use setDisplayFunnelGroup() to define
which group to display in the funnel graph. The following code defines
a simple funnel graph with one group and three series.
setData(0,0,10);
setData(1,0,20);
setData(2,0,30);
setSeriesLabel(0, "Series 0");
setSeriesLabel(1, "Series 1");
setSeriesLabel(2, "Series 2");
setDisplayFunnelGroup(0);
setDataRangeToExtent();
setGraphType(106);
setTitleString("Funnel Chart");
setSubtitleString("DisplayFunnelGroup = 0");
setTransparentBorderColor(getFrame(), true);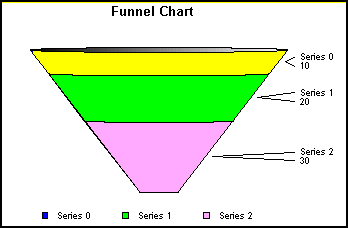
x
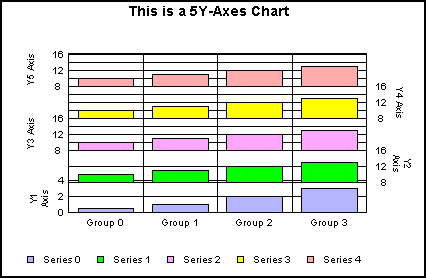
The data that is required for a multi-Y (3Y-, 4Y- or
5Y-axis) graph is the same as for any normal bar graph. By default,
axis labels are staggered with odd numbered (1/3/5) axis labels
on the left and even numbered (2/4) axis labels on the right. These default
settings can be changed with setAxisSide(). The setAxisAssignment()
method must be used to assign each series in the data set to the
desired axis (Y1, Y2, Y3, Y4, Y5).
The following example creates a 5Y-axes
graph with a single series assigned to each axis.
setDepthRadius(0);
setData(0,0,.5);
setData(0,1,1);
setData(0,2,2);
setData(0,3,3);
setData(1,0,10);
setData(1,1,11);
setData(1,2,12);
setData(1,3,13);
setData(1,0,10);
setData(2,0,10);
setData(2,1,11);
setData(2,2,12);
setData(2,3,13);
setData(3,0,10);
setData(3,1,11);
setData(3,2,12);
setData(3,3,13);
setData(4,0,10);
setData(4,1,11);
setData(4,2,12);
setData(4,3,13);
setDataRangeToExtent();
setSeriesLabel(0,"Series 0");
setSeriesLabel(1,"Series 1");
setSeriesLabel(2,"Series 2");
setSeriesLabel(3,"Series 3");
setSeriesLabel(4,"Series 4");
setGroupLabel(0,"Group 0");
setGroupLabel(1,"Group 1");
setGroupLabel(2,"Group 2");
setGroupLabel(3,"Group 3");
setGraphType(105);
setAxisAssignment(1,1);
setAxisAssignment(2,2);
setAxisAssignment(3,3);
setAxisAssignment(4,4);
setY1TitleString("Y1 Axis");
setY2TitleString("Y2 Axis");
setTextString(getY3Title(), "Y3 Axis");
setTextString(getY4Title(), "Y4 Axis");
setTextString(getY5Title(), "Y5 Axis");
setAlignMultiYBars(true);
setTitleString("This is a 5Y-Axes Chart");
The preceding example creates the following
graph output.
x
In a Pareto graph, the X-axis scale shows group numbers.
The Y-axis scale is the percent of the total accumulation for each
selected series. Each graph displays a single series. The following
methods and properties create a simple Pareto graph.
setDepthRadius(0);
setDataTextDisplay(true);
setData(0,0,.5);
setData(0,1,1);
setData(0,2,2);
setData(0,3,3);
setDataRangeToExtent();
setTitleString("Pareto Chart");
setY1TitleString("Y1 Axis");
setGraphType(102);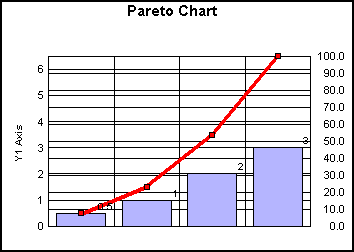
xData in a Waterfall Graph
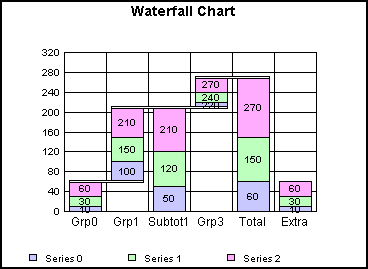
A waterfall graph (GraphTypes 100 and 101) requires
one data value for each series/group marker to be drawn in the graph.
Each setData() assigns a value to a series/group that is drawn similar
to a stacked bar graph. The group mode (normal, subtotal, total,
or extra) determines how each series/group value is interpreted.
The setWaterfallGroupMode() method assigns each group in the data
set to be graphed as a normal, subtotal, total, or extra group.
Syntax:
void setWaterfallGroupMode(int nGroup, int nGroupMode);
where:
- nGroup
Is a group number.
- nGroupMode
Can be one of the following:
int WATERFALLGROUPMODE_NORMAL = 0;
int WATERFALLGROUPMODE_SUBTOTAL = 1;
int WATERFALLGROUPMODE_TOTAL = 2;
int WATERFALLGROUPMODE_EXTRA = 3;
For a normal group, series risers are stacked on top of each
other and each successive series represents the value of its series/group
plus any preceding series/group. For a subtotal or total group,
the data for the group is ignored and the cumulative total up to
this point will be shown for this group. Only one group in a graph
can be designated as a total. An extra group is not used when performing
any waterfall cumulative sums. It will appear just as stacked data.
When used, it should be defined as the last group in the graph.
Note: The sign of each group of data can be positive or
negative. Mixed signs of data (positive and negative) for a group
will force the sign of all data for the group to be the first sign
of the data for series zero. Zero is used for any missing data and
is considered positive.
setGraphType(100);
setDepthRadius(0);
setDepthAngle(0);
setData(0, 0, 10);
setData(1, 0, 20);
setData(2, 0, 30);
setGroupLabel(0,"Grp0");
setData(0, 1, 40);
setData(1, 1, 50);
setData(2, 1, 60);
setGroupLabel(1,"Grp1");
setData(0, 2, 0);
setData(1, 2, 0);
setData(2, 2, 0);
setWaterfallGroupMode(2, 1);
setGroupLabel(getGroup(2), "Subtot1");
setData(0, 3, 10);
setData(1, 3, 20);
setData(2, 3, 30);
setGroupLabel(3, "Grp3");
setData(0, 4, 0);
setData(1, 4, 0);
setData(2, 4, 0);
setWaterfallGroupMode(4, 2);
setGroupLabel(getGroup(4), "Total");
setData(0, 5, 10);
setData(1, 5, 20);
setData(2, 5, 30);
setWaterfallGroupMode(5, 3);
setGroupLabel(getGroup(5), "Extra");
setStackedDataValueSum(true);
setDataTextDisplay(true);
setTextJustHoriz(getDataText(),1);
setFontSizeAbsolute(getDataText(),true);
setFontSize(getDataText(),10);
setFontSizeAbsolute(getO1Label(0),true);
setFontSize(getO1Label(0),12);
setDataRangeToExtent();
x
The following topics describe how data is used in the
stock graph types (70, 72...82, and 84).
x
This data set can be used to produce a Candle Open/High/Low/Close stock
graph (GraphType 70). This graph type requires four values per marker:
Open, High, Low, and Close. The following methods were added to
the data set used in GraphTypes 79...81.
setTitleString("GraphType(70); Candle Open/Hi/Lo/Close Stock Chart");
setGraphType(70);
setLineWidth(getStockHighLine(), 2);
setFillColor(getStockHighLine(), new Color (255,0,0));
setLineWidth(getStockLowLine(), 2);
setFillColor(getStockLowLine(), new Color(0,0,255));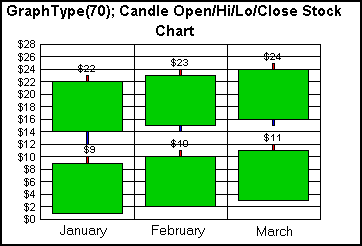
In this graph type, the size/height of each riser illustrates
Open and Close values. The data text shows each Close value. The
length of the red tick at the top of each riser extends the riser
to the stock's High value. If a stock's Low value is less than its
Open value, a tick mark will be drawn at the bottom of the riser
to show how much less the low value is from the open. These tick
marks are shown in blue in the top risers in the example graph above.
x
The Candle Open/Close stock graph (GraphType 72) requires
two values per marker: Open and Close.
setData(0,0,30); // Open
setData(0,1,20); // Close
setData(0,2,50); // Open
setData(0,3,40); // Close
setData(0,4,60); // Open
setData(0,5,30); // Close
setData(1,0,2);
setData(1,1,1);
setData(1,2,5);
setData(1,3,4);
setData(1,4,6);
setData(1,5,3);
setGraphType(72);
setDataRange(0,0,1,6);
setDataTextDisplay(true);
setDataTextFormat(6);
setY1LabelFormat(6);
setTitleString("GraphType(72); Candle: Open/Close");
setLegendDisplay(true);
setSeriesLabel(0, "Company 1");
setSeriesLabel(1, "Company 2");
setGroupLabel(0, "January");
setGroupLabel(1, "February");
setGroupLabel(2, "March");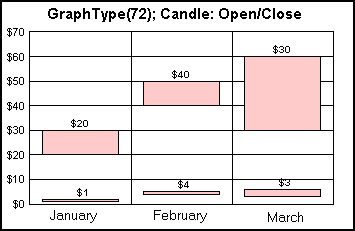
x
For High/Low stock graphs (GraphType 73...75), the graph
requires two values (high and low) for each riser to be drawn in
the graph. The following example data defines two series (rows 0
and 1) and three high/low values (0...5 columns) for each series.
setData(0,0,30); // Company 1 - Stock 1/January High
setData(0,1,20); // Company 1 - Stock 1/January Low
setData(0,2,50); // Company 1 - Stock 1/February High
setData(0,3,40); // Company 1 - Stock 1/February Low
setData(0,4,60); // Company 1 - Stock 1/March High
setData(0,5,30); // Company 1 - Stock 1/March Low
setData(1,0,2); // Company 2 - Stock 2/January High
setData(1,1,1); // Company 2 - Stock 2/January Low
setData(1,2,5); // Company 2 - Stock 2/February High
setData(1,3,4); // Company 2 - Stock 2/February Low
setData(1,4,6); // Company 2 - Stock 2/March High
setData(1,5,3); // Company 2 - Stock 2/March Low
setGraphType(73);
setDataRange(0,0,1,6);
setDataTextDisplay(true);
setDataTextFormat(6);
setY1LabelFormat(6);
setTitleString("GraphType(73); Hi/Lo Stock Chart");
setLegendDisplay(true);
setSeriesLabel(0, "Company 1");
setSeriesLabel(1, "Company 2");
setGroupLabel(0, "January");
setGroupLabel(1, "February");
setGroupLabel(2, "March");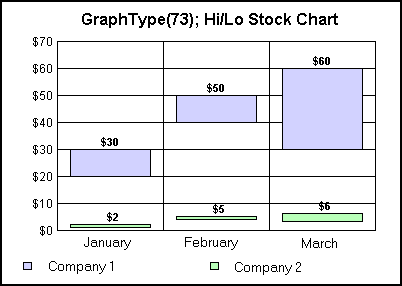
x
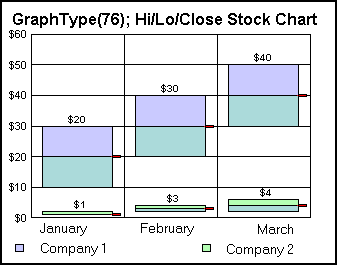
The High/Low/Close stock graph requires 3 values per
marker in the following order: High, Low, and Close:
setData(0,0,30);
setData(0,1,10);
setData(0,2,20);
setData(0,3,40);
setData(0,4,20);
setData(0,5,30);
setData(0,6,50);
setData(0,7,30);
setData(0,8,40);
setData(1,0,2);
setData(1,1,1);
setData(1,2,1);
setData(1,3,4);
setData(1,4,2);
setData(1,5,3);
setData(1,6,6);
setData(1,7,2);
setData(1,8,4);
setGraphType(76);
setDataRange(0,0,1,9);
setDataTextDisplay(true);
setDataTextFormat(6);
setY1LabelFormat(6);
setTitleString("GraphType(76); Hi/Lo/Close Stock Chart");
setLegendDisplay(true);
setSeriesLabel(0, "Company 1");
setSeriesLabel(1, "Company 2");
setGroupLabel(0, "January");
setGroupLabel(1, "February");
setGroupLabel(2, "March");
setFillColor(getStockCloseTick(), new Color (255,0,0));
setStockTickLength(100);
The preceding example creates the following
graph output.
x
For normal stock graphs that show high, low, open, and
close values (GraphType 79...81), four values are required for each
data point. The four values must be supplied in the following order:
Open Value, High Value, Low Value, and Close Value. The setData()
methods used in the example code that follows, plot the data for
three stocks/groups using the Open, High, Low, and Close values
shown in the following table.
| |
Open
|
High
|
Low
|
Close
|
|---|
|
Series 1/ Stock 1 (setData(0,0...3))
|
1
|
10
|
2
|
9
|
|
Series 1/Stock 2 (setData(0,4...7))
|
2
|
11
|
3
|
10
|
|
Series 1/Stock 3 (setData(0,8...11))
|
3
|
12
|
4
|
11
|
|
Series 2/Stock 1 (setData(1,0...3))
|
14
|
23
|
12
|
22
|
|
Series 2/Stock 2 (setData(1,4...7))
|
15
|
24
|
14
|
23
|
|
Series 2/Stock 3 (setData(1,8...11))
|
16
|
25
|
15
|
24
|
The following example code uses setData()
methods.
setData(0,0,1);
setData(0,1,10);
setData(0,2,2);
setData(0,3,9);
setData(0,4,2);
setData(0,5,11);
setData(0,6,3);
setData(0,7,10);
setData(0,8,3);
setData(0,9,12);
setData(0,10,4);
setData(0,11,11);
setData(1,0,14);
setData(1,1,23);
setData(1,2,12);
setData(1,3,22);
setData(1,4,15);
setData(1,5,24);
setData(1,6,14);
setData(1,7,23);
setData(1,8,16);
setData(1,9,25);
setData(1,10,15);
setData(1,11,24);
setDataRange(0,0,1,12);
setDataTextDisplay(true);
setDataTextFormat(6);
setY1LabelFormat(6);
setLegendDisplay(true);
setSeriesLabel(0, "Company 1");
setSeriesLabel(1, "Company 2");
setGroupLabel(0, "January");
setGroupLabel(1, "February");
setGroupLabel(2, "March");
setStockTickLength(100);
setFillColor(getStockOpenTick(), new Color (255,0,0));
setFillColor(getStockCloseTick(), new Color(255,255,0));
setY1MajorGridStep(2);
setTitleString("GraphType(79); Open/Hi/Lo/Close Stock Chart");
setGraphType(79);
The preceding code generates the following
graph output.
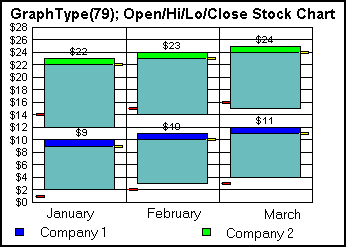
The size/height of each riser illustrates low/high values. The
red tick marks identify open values. The yellow tick marks and data
text show close values. The bar at the top of each riser illustrates
the difference between close and high values.
x
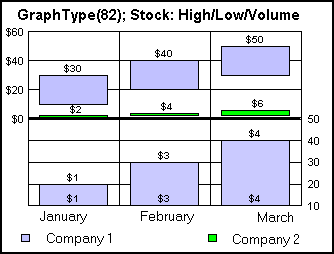
The stock High/Low/Volume graph requires three values
per marker: High, Low, and Volume.
setData(0,0,30);
setData(0,1,10);
setData(0,2,20);
setData(0,3,40);
setData(0,4,20);
setData(0,5,30);
setData(0,6,50);
setData(0,7,30);
setData(0,8,40);
setData(1,0,2);
setData(1,1,1);
setData(1,2,1);
setData(1,3,4);
setData(1,4,2);
setData(1,5,3);
setData(1,6,6);
setData(1,7,2);
setData(1,8,4);
setGraphType(82);
setDataRange(0,0,1,9);
setDataTextDisplay(true);
setDataTextFormat(6);
setY1LabelFormat(6);
setTitleString("GraphType(82); Stock: High/Low/Volume");
setLegendDisplay(true);
setSeriesLabel(0, "Company 1");
setSeriesLabel(1, "Company 2");
setGroupLabel(0, "January");
setGroupLabel(1, "February");
setGroupLabel(2, "March");
setFillColor(getStockCloseTick(), new Color (255,0,0));
setStockTickLength(100);
The preceding code generates the following
graph output.
x
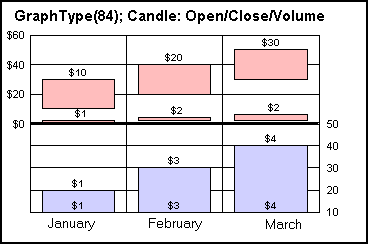
The Candle Open/Close/Volume graph requires three values
per marker: Open, Close, and Volume.
setData(0,0,30);
setData(0,1,10);
setData(0,2,20);
setData(0,3,40);
setData(0,4,20);
setData(0,5,30);
setData(0,6,50);
setData(0,7,30);
setData(0,8,40);
setData(1,0,2);
setData(1,1,1);
setData(1,2,1);
setData(1,3,4);
setData(1,4,2);
setData(1,5,3);
setData(1,6,6);
setData(1,7,2);
setData(1,8,4);
setGraphType(84);
setDataRange(0,0,1,9);
setDataTextDisplay(true);
setDataTextFormat(6);
setY1LabelFormat(6);
setTitleString("GraphType(84); Candle: Open/Close/Volume");
setLegendDisplay(true);
setSeriesLabel(0, "Company 1");
setSeriesLabel(1, "Company 2");
setGroupLabel(0, "January");
setGroupLabel(1, "February");
setGroupLabel(2, "March");
setFillColor(getStockCloseTick(), new Color (255,0,0));
setStockTickLength(100);
The preceding code generates the following
graph output.
x
A time scale axis uses time to display data. Clustered
Bar, Stacked Bar, Line, and Scatter graphs may use a time scale
axis. The following time intervals can be specified in each of these
graph types:
TIME_INTERVAL_UNDEFINED = 0
TIME_INTERVAL_SECONDS = 1
TIME_INTERVAL_MINUTES = 2
TIME_INTERVAL_HOURS = 3
TIME_INTERVAL_DAYS = 4
TIME_INTERVAL_WEEKS = 5
TIME_INTERVAL_MONTHS = 6
TIME_INTERVAL_QUARTERS = 7
TIME_INTERVAL_YEARS = 8
It is often useful to represent data with several intervals shown
simultaneously on a time axis scale.
The following example shows three intervals,
which are weeks, months, and years.
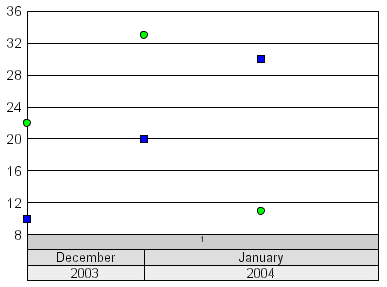
The level intervals must be set in decreasing order -- the level
zero interval must be less than level one, level one must be less
than level two. In this example, the following methods were used
to set the level intervals:
setLevelInterval(0, Interval.TIME_INTERVAL_WEEKS);
setLevelInterval(1, Interval.TIME_INTERVAL_MONTHS);
setLevelInterval(2, Interval.TIME_INTERVAL_YEARS);
Each level can be formatted independently
using properties and methods you can apply to any other label object
(for example, font size, font color, word wrap, anti-alias, and
so on). The following properties and methods handle functionality
specific to the Time Scale Axis:
- UseTimeScaleAxis;
Property to enable/disable time scale axis.
- get/setLevelDateFormat();
Get/set the date format of a level.
- get/setLevelFillColor();
Get/set the fill color of a level.
- get/setLevelHeight();
Get/set the height of a level in virtual coordinates.
- get/setLevelInterval();
Get/set the time interval of a level.
- setLevelBorderColor();
Set the border color of a level.
- setLevelTextColor();
Set the text color of a level.
- get/setLevelTextFormat();
Get/set the text format of a level.
The
setLevelTextFormat() method defines how time axis scale labels are
drawn.
IIntervalScale.FORMAT_SHORT = 0
IIntervalScale.FORMAT_MEDIUM = 1
IIntervalScale.FORMAT_LONG = 2
IIntervalScale.FORMAT_RAW = 3
The format in which text is drawn depends
on the level interval set by setLevelInterval(). The following table
shows how each text format is represented for each level:
Interval Level | FORMAT_SHORT | FORMAT_MEDIUM | FORMAT_LONG |
|---|
TIME_INTERVAL_SECONDS | 1 | Sec 1 | Second 1 |
TIME_INTERVAL_MINUTES | 1 | Min 1 | Minute 1 |
TIME_INTERVAL_HOURS | 1 | Hour 1 | Hour 1 |
TIME_INTERVAL_DAYS | 1 | Day 1 | Day 1 |
TIME_INTERVAL_WEEKS | 1 | Week 1 | Week 1 |
TIME_INTERVAL_MONTHS | 1 | Mon 1 | Month 1 |
TIME_INTERVAL_QUARTERS | 1 | Q 1 | Quarter 1 |
TIME_INTERVAL_YEARS | 1 | 01 | 2001 |
If setLevelTextFormat() selects FORMAT_RAW,
you can specifically define how date and time text is formatted
using setLevelDateFormat() and standard Java SimpleDateFormat codes,
which are listed and described in the following table.
Code | Code Description |
|---|
G | Era Designation (for example, AD) |
y | Year (for example, 2004, 04) |
M | Month in year (for example, March, Mar., 03) |
w | Week in year (for example,1...52) |
W | Week in month (for example, 2) |
D | Day in year (for example, 1...365) |
d | Day in month (for example, 10) |
F | Day of week in month (for example, 2) |
E | Day in week (for example, Tuesday, Tue) |
a | AM/PM Marker (for example, PM) |
H | Zero-Based Hour in day (for example, 0...23) |
k | Hour in day (for example, 1...24) |
K | Zero-Based Hour in AM/PM (for example, 0...11) |
h | Hour in AM/PM (for example, 1...11) |
m | Minute in hour (for example, 30) |
s | Second in minute (for example, 55) |
S | Millisecond (for example, 978) |
z | General Time Zone (for example, Pacific Standard
Time, PST, GMT-08:00 |
Z | RFC 822 Time Zone (for example, -0800) |
Examples:
If the date/time is set to July 4, 2001
12:08:56 local time in the United States Pacific Time zone, the
following is an example of the necessary code:
setLevelTextFormat(FORMAT_RAW);
setLevelDateFormat("yyyy.MM.dd G 'at' HH:mm:ss z");
2001.07.04 AD at 12:08:56 PDT
setLevelTextFormat(FORMAT_RAW);
setLevelDateFormat("EEE, MMM d, ''yy");
Wed, Jul 4, '01
setLevelTextFormat(FORMAT_RAW);
setLevelDateFormat("hh 'o''clock' a, zzzz");
12 o'clock PM, Pacific Daylight Time
setLevelTextFormat(FORMAT_RAW);
setLevelDateFormat("yyyyy.MMMMM.dd GGG hh:mm aaa");
02001.July.04 AD 12:08 PM
The following methods must be used to
set the starting and ending date boundaries of the graph:
- setStartDate();
- setEndDate();
The following properties can be used
to define major and minor grid ticks on a time axis scale.
- MajorGridTickInterval
- MinorGridTickInterval
You must use the setData() methods to define dates/times and
data to be graphed. Each data point to be graphed requires two values:
a date/time specification and a value.
Example:
restoreDefaults();
setUseTimeScaleAxis(true);
clearDataLabels();
clearGroupLabels();
clearSeriesLabels();
setLegendDisplay(false);
setDepthRadius(0);
clearDataStorage();
setData(0,0,12,28,2003); // date
setData(0,1,10.0);       // value
setData(0,2,12,29,2003);
setData(0,3,20.0);
setData(0,4,12,30,2003);
setData(0,5,30.0);
setData(0,6,12,31,2003);
setData(0,7,25.0);
setData(0,8,01,01,2004);
setData(0,9,20.0);
setData(0,10,01,2,2004);
setData(0,11,25.0);
setData(0,12,01,3,2004);
setData(0,13,22.0);
setData(0,14,01,4,2004);
setData(0,15,23.0);
setData(1,0,12,28,2003);
setData(1,1,12.0);
setData(1,2,12,29,2003);
setData(1,3,12.0);
setData(1,4,12,30,2003);
setData(1,5,21.0);
setData(1,6,12,31,2003);
setData(1,7,15.0);
setData(1,8,01,01,2004);
setData(1,9,23.0);
setData(1,10,1,2,2004);
setData(1,11,25.0);
setData(1,12,1,3,2004);
setData(1,13,25.0);
setData(1,14,1,4,2004);
setStartDate(12,28,2003);
setEndDate(1,4,2004);
setDataRangeToExtent();
setGraphType(17);
setSeriesType(getSeries(0), 1);
setSeriesType(getSeries(1), 2);
setUseTimeScaleAxis(true);
setLevelInterval(0,4);
setLevelInterval(1,6);
setLevelInterval(2,8);
setLevelTextFormat(0,0);
setLevelTextFormat(1,2);
setLevelTextFormat(2,2);
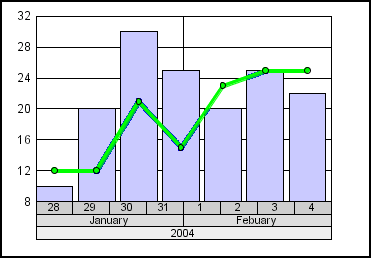
The DateUtils.getDateTime() method is optional and can be used
to return a date as a Java Calendar Object.
Example:
Calendar start = DateUtils.getDateTime ();
Calendar end = DateUtils.getDateTime ();
setStartDate(start);
setEndDate(end);
TimeScaleAxis.setTimeScaleAxisDefaults() is an optional method
that can be called to do clean up.


