Syntax: How to Assign a Series Label
series: [
   {
      series: snumber,
      label: 'string',
   }
]
where:
- snumber
Is a zero-based series number. If the series does not exist in the chart, the property is ignored.
- 'string'
is a string that defines the series label.
Example: Assigning Series Labels
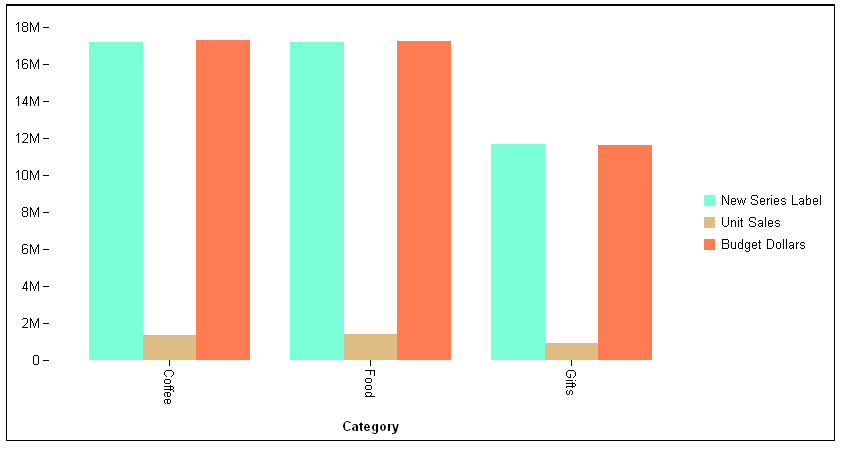
The following request against the GGSALES data source generates a vertical bar chart and assigns a new label to series 0. You can see the new label in the legend, which is positioned to the right of the chart:
GRAPH FILE GGSALES
SUM DOLLARS UNITS BUDDOLLARS
BY CATEGORY
ON GRAPH PCHOLD FORMAT JSCHART
ON GRAPH SET LOOKGRAPH VBAR
ON GRAPH SET STYLE *
*GRAPH_JS
legend: {position: 'right'},
series: [
   {series: 0, color: 'aquamarine', label: 'New Series Label'},
   {series: 1, color: 'burlywood'},
   {series: 2, color: 'coral'}
]
*END
ENDSTYLE
END
The output is:
