axisname: {
  intervalMode: 'mstring',
  intervalValue: inumber}
where:
- axisname
Can be:
- xaxisOrdinal
- xaxisNumeric
- yaxis
- y2axis
- zaxisOrdinal
- 'mstring'
Is a string that defines the interval mode. Valid values are:
- 'count', which indicates that intervalValue will specify the number of major grid lines to draw.
- 'interval', which indicates that intervalValue will specify the interval at which major grid lines are drawn.
- 'skip', which indicates that intervalValue will specify the number of major grid lines to skip.
The default value is undefined, which automatically calculates the number and frequency of major grid lines.
- inumber
Is a number that depends on the intervalMode. if intervalMode is 'count', set this property to the number of major grid lines to draw. If intervalMode is 'interval', set this property to the interval at which major grid lines are drawn. If intervalMode is 'skip', set this property to the number of grid lines to skip. The default value is undefined which automatically calculates the number and frequency of major grid lines.
Note: The first and last grid lines are always drawn regardless of the intervalMode or intervalValue.
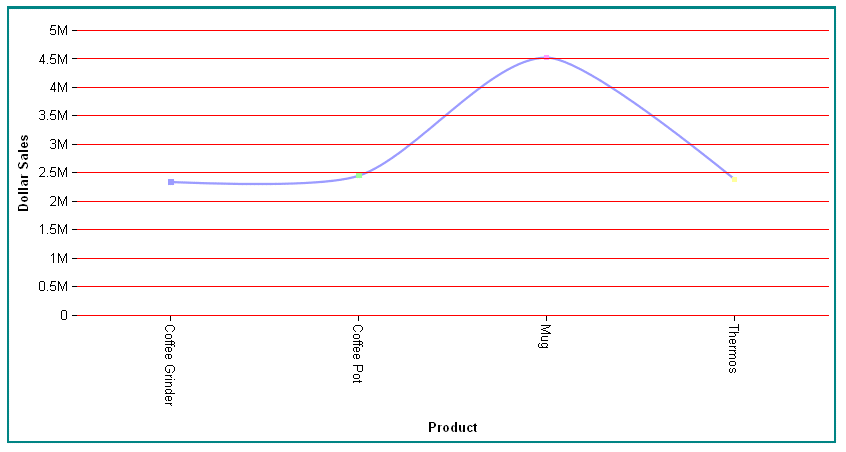
The following request against the GGSALES data source generates a vertical line chart with major grid lines calculated automatically:
GRAPH FILE GGSALES
SUM DOLLARS
BY PRODUCT
WHERE CATEGORY EQ 'Gifts'
ON GRAPH PCHOLD FORMAT JSCHART
ON GRAPH SET LOOKGRAPH VLINE
ON GRAPH SET STYLE *
*GRAPH_JS
border: {width: 2, color: 'teal'},
blaProperties: {lineConnection: 'curved'},
yaxis: {
  intervalMode: undefined, intervalValue: undefined, // default values
  majorGrid: {visible: true, aboveRisers: true, lineStyle: {color: 'red'}},
}
*END
ENDSTYLE
END
The output is:

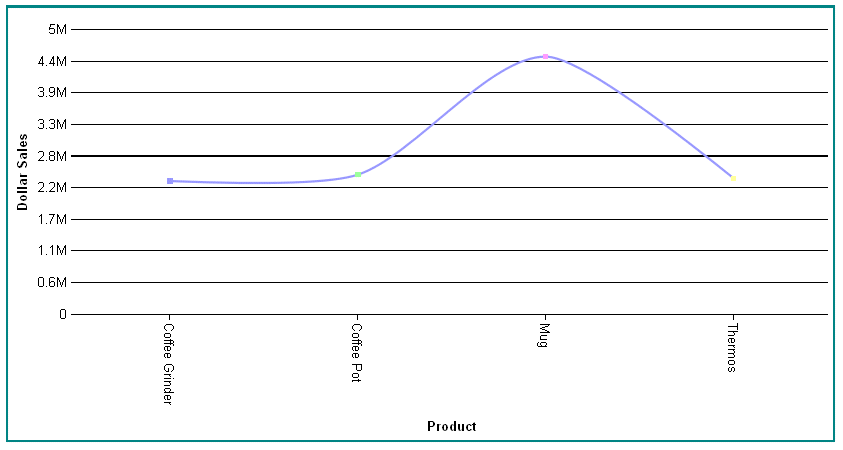
The following version of the request draws 10 major grid lines:
GRAPH FILE GGSALES
SUM DOLLARS
BY PRODUCT
WHERE CATEGORY EQ 'Gifts'
ON GRAPH PCHOLD FORMAT JSCHART
ON GRAPH SET LOOKGRAPH VLINE
ON GRAPH SET STYLE *
*GRAPH_JS
border: {width: 2, color: 'teal'},
blaProperties: {lineConnection: 'curved'},
yaxis: {
    majorGrid: {visible:true},
     intervalMode: 'count',
     intervalValue: 10
}
*END
ENDSTYLE
END
The output is:

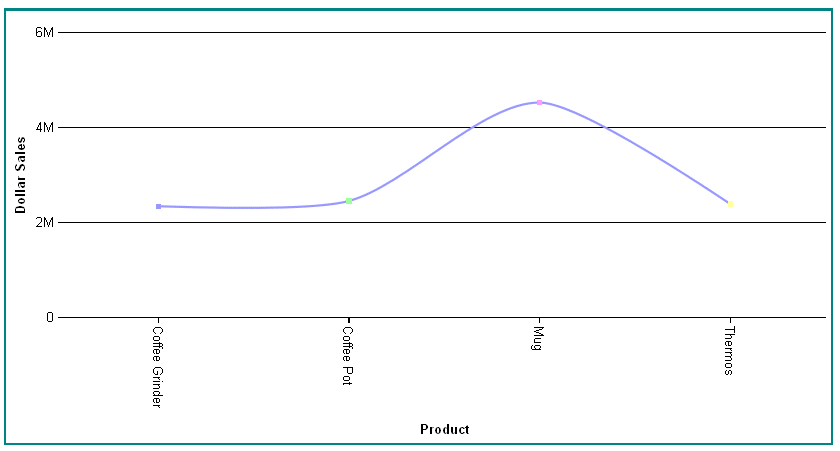
The following version of the request draws major grid lines at intervals of two million:
GRAPH FILE GGSALES
SUM DOLLARS
BY PRODUCT
WHERE CATEGORY EQ 'Gifts'
ON GRAPH PCHOLD FORMAT JSCHART
ON GRAPH SET LOOKGRAPH VLINE
ON GRAPH SET STYLE *
*GRAPH_JS
border: {width: 2, color: 'teal'},
blaProperties: {lineConnection: 'curved'},
yaxis: {
    majorGrid: {visible:true},
    intervalMode: 'interval',
    intervalValue: 2000000
}
*END
ENDSTYLE
END
The output is:

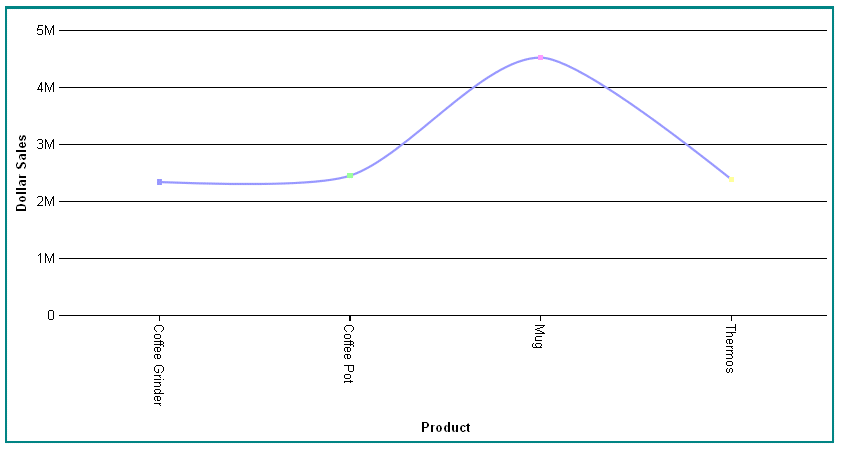
The following version skips every other automatic major grid line:
GRAPH FILE GGSALES
SUM DOLLARS
BY PRODUCT
WHERE CATEGORY EQ 'Gifts'
ON GRAPH PCHOLD FORMAT JSCHART
ON GRAPH SET LOOKGRAPH VLINE
ON GRAPH SET STYLE *
*GRAPH_JS
border: {width: 2, color: 'teal'},
blaProperties: {lineConnection: 'curved'},
yaxis: {
majorGrid: {visible:true},
intervalMode: 'skip',
intervalValue: 1
}
*END
ENDSTYLE
END
The output is:
