title: {
   text: 'textstring',
   visible: boolean,
   align: 'astring',
   font: 'fstring',
   color: 'cstring'
  }
where:
- 'textstring'
Is a string that defines the title text. The default value is 'Chart Title'.
- boolean
Controls the visibility of the chart title. Valid values are:
- true, which makes the chart title visible.
- false, which makes the chart title not visible. This is the default value.
- 'astring'
Is a string that defines the alignment of the title, Valid values are:
- 'center', which centers the title in the draw area. This is the default value.
- 'chartFrame', which centers the title aligned with the chart frame.
- 'left', which left-justifies the chart title in the draw area.
- 'right', which right-justifies the chart title in the draw area.
- 'fstring'
Is a string that defines the size, style, and, typeface of the chart title. The default value is '10pt Sans-Serif'.
- 'cstring'
Is a string that defines the color of the chart title using a color name or numeric specification string. The default value is 'black'.
For information about specifying colors, see Colors and Gradients.
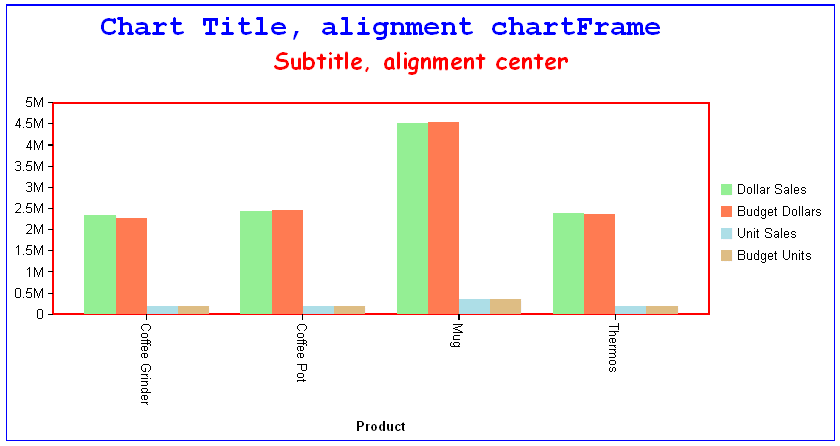
The following request against the GGSALES data source generates a vertical bar chart with a title and subtitle. The alignment of the title is 'chartFrame', and the alignment of the subtitle is 'center':
GRAPH FILE GGSALES
SUM DOLLARS BUDDOLLARS UNITS BUDUNITS
BY PRODUCT
WHERE CATEGORY EQ 'Gifts'
ON GRAPH PCHOLD FORMAT JSCHART
ON GRAPH SET LOOKGRAPH VBAR
ON GRAPH SET STYLE *
*GRAPH_JS
border:{color:'blue'},
chartFrame: {border: {width:2, color:'red'}},
legend: {position:'right'},
    title: {
         text: 'Chart Title, alignment chartFrame',
         visible: true,
         font: 'Bold 20pt Courier',
         align: 'chartFrame',
         color: 'blue'},
subtitle: {
   text: 'Subtitle, alignment center',
   font: 'Bold 16pt Comic Sans MS',
   visible: true,
   align: 'center',
   color: 'red'
   },
series: [
    {series: 0, color: 'lightgreen'},
    {series: 1, color: 'coral'},
    {series: 2, color: 'lightblue'},
    {series: 3, color: 'burlywood'}
]
*END
ENDSTYLE
END
On the output, the title is centered aligned with the chart frame (align: 'chartFrame'), and the subtitle is centered in the draw area (align: 'center'):

The following request against the GGORDER data source generates a bullet chart with a chart title.
DEFINE FILE GGORDER
YEARY/YY = ORDER_DATE;
YEAR1/YY = IF YEARY EQ 1990 THEN 1998 ELSE YEARY;
END
GRAPH FILE GGORDER
SUM QUANTITY
BY YEAR1
WHERE QUANTITY NE 712
ON GRAPH SET VAXIS 80
ON GRAPH PCHOLD FORMAT JSCHART
ON GRAPH SET LOOKGRAPH CUSTOM
ON GRAPH SET STYLE *
*GRAPH_JS
chartType: 'bullet',
border: {width: 1, color: 'blue'},
title: {visible:true,text: 'Chart Title', color: 'red'},
series: [
{series: 0, group: 0, color: 'steelblue'},
{series: 0, group: 1, color: 'white',marker: {size: 14, shape:
'triangle',border: {width: 1, color: 'black'}}},
],
bulletProperties: {drawFirstValueAsBar: true},
*END
ENDSTYLE
END
The output is:
