Syntax: How to Control Space Between Risers in 3D Charts
riserDepthGap: numberwhere:
- number
Is a number between 0 and 1 that defines the margin between the risers as a factor of the depth. The default value is 0.2.
Example: Controlling the Space Between Risers in 3D Charts
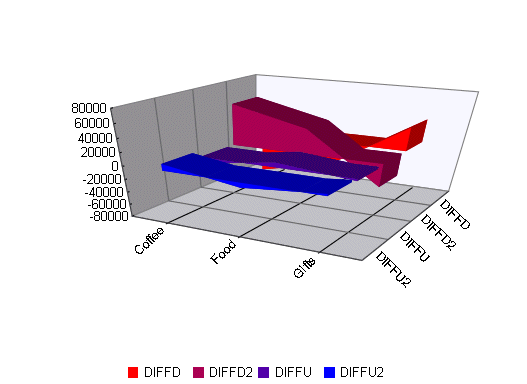
The following request against the GGSALES data source generates a 3D area chart with the default space between the risers:
DEFINE FILE GGSALES
DIFFD = DOLLARS-BUDDOLLARS;
DIFFU = UNITS-BUDUNITS;
DIFFD2 = BUDDOLLARS-DOLLARS;
DIFFU2 = BUDUNITS-UNITS;
END
GRAPH FILE GGSALES
SUM DIFFD DIFFD2 DIFFU DIFFU2
BY CATEGORY
ON GRAPH PCHOLD FORMAT JSCHART
ON GRAPH SET LOOKGRAPH 3DAREAS
ON GRAPH SET STYLE *
*GRAPH_JS
riserDepthGap: 0.2,
chartFrame: {border: {width: 1, color: 'grey'}, fill: {color:
'ghostwhite'}},
colorMode: {
   mode: 'byInterpolation',
   colorList: ['red', 'blue']
}
*END
ENDSTYLE
END
The output is:

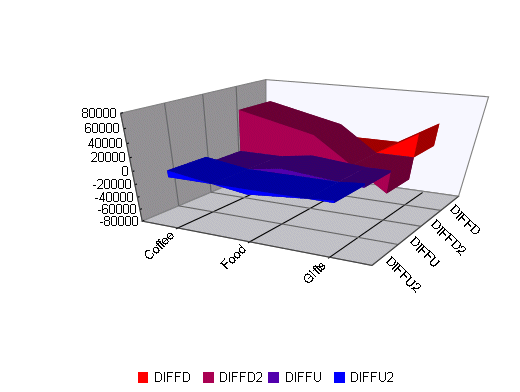
Changing the riserDepthGap to zero (0) generates the following chart:

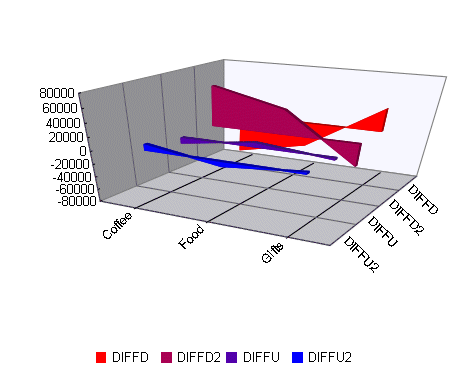
The value 0.9 for riserDepthGap generates the following chart:
