Treemap Chart Properties (treemapProperties)

In this section:

These properties control the appearance of header cells and cell borders in a treemap chart. This code segment shows the default values.

treemapProperties: {
   scaleCellFonts: false,  
   header: {
      height: undefined,  
      fill: 'lightgrey', 
      border: {
         width: 0,
         color: 'lightgrey',
         dash: ''
      },
      label: {
         visible: true,
         font: '8pt Sans-Serif',
         color: 'black'
      }
   },
   cellBorder: {  
      width: 1,
      color: 'white',
      dash: '',
      outerCellWidth: 3
   }
},

Top of page

x
Scaling Fonts in Treemap Cells

How to:

The scaleCellFonts property controls how labels are drawn in the treemap cells.


x
Syntax: How to Scale Fonts in Treemap Cells
treemapProperties: {
   scaleCellFonts: boolean,  

where:

boolean

Valid values are:

  • true, which scales font sizes for labels drawn inside each cell according to the cell area.
  • false, which uses the same font size for all cell labels and does not draw labels when the label size exceeds the cell size. The default value is false.


Example: Scaling Fonts in Treemap Cells

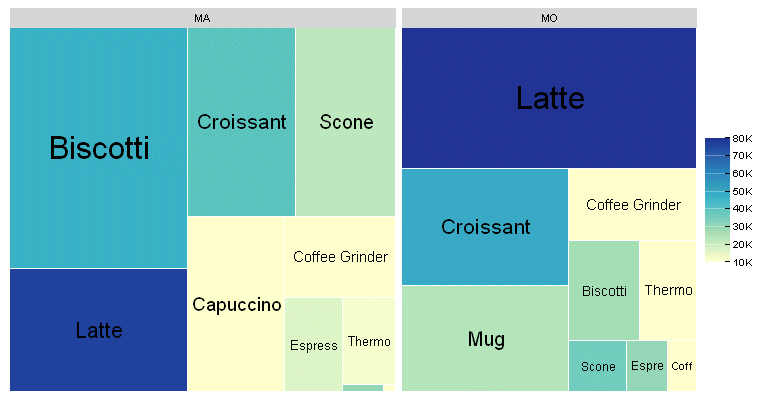
The following request references a join between the GGSALES and GGSTORES data sources to generate a treemap chart. The scaleCellFonts property is set to true:

JOIN STCD IN GGSALES TO STORE_CODE IN GGSTORES AS J1
DEFINE FILE GGSALES
PROFIT/D12.2= DOLLARS-BUDDOLLARS ;
END
GRAPH FILE GGSALES
SUM PROFIT UNITS
BY ST
BY PRODUCT
WHERE ST EQ 'MO' OR 'MA'
ON GRAPH PCHOLD FORMAT JSCHART
ON GRAPH SET LOOKGRAPH TREEMAP
ON GRAPH SET STYLE *
*GRAPH_JS
treemapProperties: {
   scaleCellFonts: true},
colorMode:'byInterpolation',
colorModecolors: ['teal','cyan', 'beige', 'burlywood', 'yellow', 'cream']
*END
ENDSTYLE
END

On the output, the cells with larger areas have labels with larger font sizes:


Top of page

x
Formatting the Treemap Header

How to:

These properties format the header in a treemap chart.


x
Syntax: How to Format a Treemap Header
treemapProperties: {
      header: {
      height: hheight,  
      fill: fcolor, 
      border: {
         width: bwidth,
         color: 'bcstring',
         dash: 'dstring'
      },
      label: {
         visible: boolean,
         font: 'fstring',
         color: 'lcsrting'
      }
hheight

Defines the height of the header. Valid values are:

  • undefined, which automatically calculates the header height. 33% larger than the header label height. This is the default value.
  • A number that defines the height in pixels.
  • A string that includes a percent symbol, enclosed in single quotation marks (for example, '5%'). When this property is set to a percent string, the header height will be the specified percentage of the overall height of the treemap.
fcolor

Can be undefined, a color definition, or a gradient definition. The default value is 'lightgrey'. For information about defining colors and gradients, see Colors and Gradients.

bwidth

Is a number of pixels that defines the width of the header border. The default value is 0.

'bcstring'

Is a color or gradient definition string that defines the border color. The default value is 'lightgrey'.

'dstring'

Is a string that defines the dash style of the header border. The default value is '', which produces a solid line. Use a string of numbers that defines the width of a dash followed by the width of the gap between dashes (for example, dash: '1 1' draws a dotted line).

boolean

Controls the visibility of the header label. Valid values are:

  • true, which makes the header label visible. This is the default value.
  • false, which makes the header label not visible.
'fstring'

Is a font string that defines the font of the header label. The default value is '8pt Sans-Serif'.

'lcstring'

Is a color definition string that defines the color of the header label. The default value is 'black'.


Example: Formatting a Treemap Header

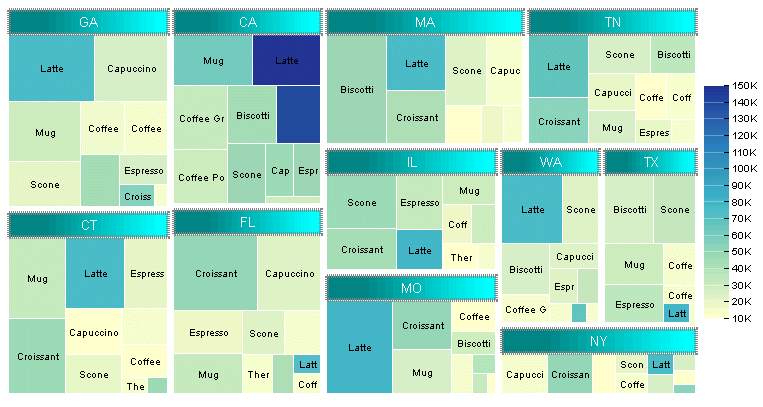
The following request references a join between the GGSALES and GGSTORES data sources to generate a treemap chart. The header is 25 pixels high. Its border is a grey dashed line 4 pixels wide, filled with a linear gradient that transitions from teal to cyan. The label in the header is white and 10pt Sans-Serif:

JOIN STCD IN GGSALES TO STORE_CODE IN GGSTORES AS J1
DEFINE FILE GGSALES
PROFIT/D12.2= DOLLARS-BUDDOLLARS ;
END
GRAPH FILE GGSALES
SUM PROFIT UNITS
BY ST
BY PRODUCT
ON GRAPH PCHOLD FORMAT JSCHART
ON GRAPH SET LOOKGRAPH TREEMAP
ON GRAPH SET STYLE *
*GRAPH_JS
treemapProperties: {
  header: {
   height: 25,
   fill: 'linear-gradient(0%,0%,100%,0%, 20% teal, 95% cyan)', 
   border: {width: 4,color: 'grey', dash:'1 1'},
   label: {visible: true,font: '10pt Sans-Serif',color: 'white'}   
   }
}
*END
ENDSTYLE
END

The output is:


Top of page

x
Formatting Treemap Cell Borders

How to:

These properties format the treemap cell borders.


x
Syntax: How to Format Treemap Cell Borders
treemapProperties: {
    cellBorder: {  
      width: number1,
      color: 'cstring',
      dash: 'dstring',
      outerCellWidth: number2   }
},

where:

number1

Is a number that defines the width of the cell border in pixels. The default value is 1.

'cstring'

Is a color or gradient definition string that defines the cell border color. The default value is 'white'.

'dstring'

Is a string that defines the dash style of the cell border. The default value is '', which produces a solid line. Use a string of numbers that defines the width of a dash followed by the width of the gap between dashes (for example, dash: '1 1' draws a dotted line).

number2

Is a number of pixels that defines the width of the border to draw around the top-level of cells. This property controls the width of the borders around only the top-level (root) nodes. The default value is 3.


Example: Formatting Treemap Cell Borders

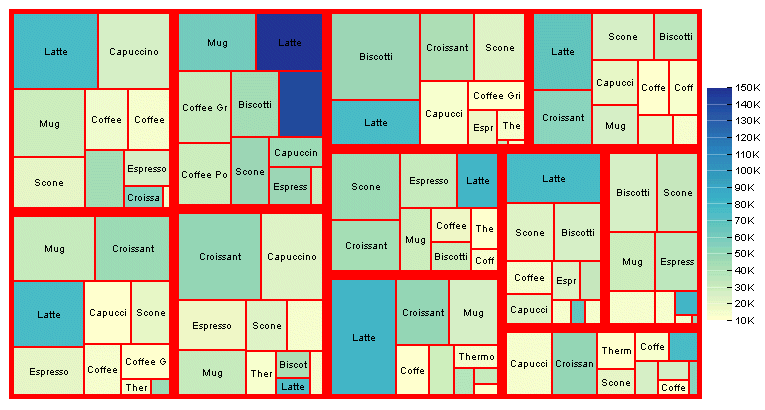
The following request references a join between the GGSALES and GGSTORES data sources to generate a treemap chart. The headers are eliminated by making their height zero (0). The cell borders are red with a width of 2 pixels, and the outer border has a width of 4 pixels:

JOIN STCD IN GGSALES TO STORE_CODE IN GGSTORES AS J1
DEFINE FILE GGSALES
PROFIT/D12.2= DOLLARS-BUDDOLLARS ;
END
GRAPH FILE GGSALES
SUM PROFIT UNITS
BY ST
BY PRODUCT
ON GRAPH PCHOLD FORMAT JSCHART
ON GRAPH SET LOOKGRAPH TREEMAP
ON GRAPH SET STYLE *
*GRAPH_JS
treemapProperties: {
header: {height: 0},
cellBorder: {width: 2,color: 'red', outerCellWidth: 4}
}
*END
ENDSTYLE
END

The output is:


WebFOCUS