Syntax: How to Control Parabox Properties
paraboxProperties: {
  activeGroup: 'agroup'
},
where:
- 'agroup'
Is a string that defines the group (specified by its label) that is active. The active group defines coloring for the lines that comes through it. The default value is undefined.
Example: Setting the Active Group in a Parabox
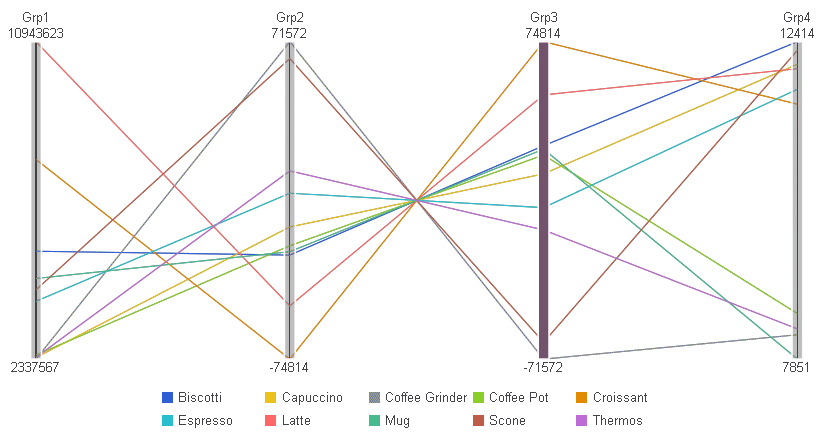
The following request against the GGSALES data source makes Grp3 the active group:
DEFINE FILE GGSALES
PROFIT = DOLLARS-BUDDOLLARS;
LOSS = BUDDOLLARS-DOLLARS;
END
GRAPH FILE GGSALES
SUM DOLLARS PROFIT LOSS
COMPUTE
AVE_SALES = AVE.DOLLARS;
BY PRODUCT
ON GRAPH PCHOLD FORMAT JSCHART
ON GRAPH SET LOOKGRAPH PARABOX
ON GRAPH SET STYLE *
*GRAPH_JS
legend: {visible: true},
groupLabels: ['Grp1','Grp2','Grp3','Grp4'],
paraboxProperties:
   {activeGroup: 'Grp3'}
*END
INCLUDE=ENIADefault_combine.sty,$
ENDSTYLE
END
On the output, Grp4 is a different color from the other groups:
