|
General
|
|
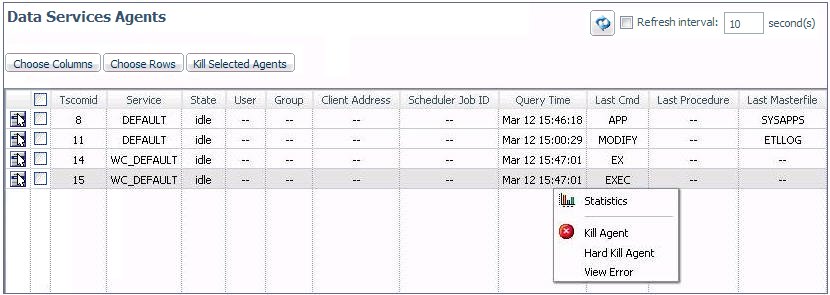
Tscomid
|
Identification number associated with the
Data Service Agent.
|
|
Service
|
Name of the data service for the agent.
|
|
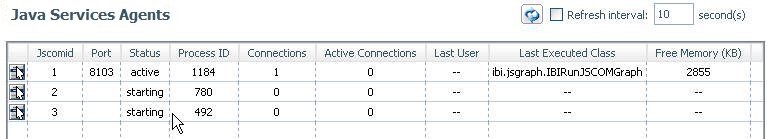
State
|
Current state of the agent. Possible values
are in use, DBMS call, idle, aborted, crashed, stopping, or starting.
A
session connects and is in use until the moment that it disconnects.
This includes all time spent between a session suspension and resumption
when the process is not using the CPU but still has resources allocated
for at least one session.
DBMS call indicates that
the agent is waiting for a database to return data.
Idle
means that the agent is not connected. It has no sessions at all,
whether active or suspended.
Aborted and crashed are abnormal
states resulting from a fatal software error detected by the program
(aborted) or by the operating system (crashed). The agent process
is no longer running, and these states are provided for diagnostic
purposes. The Server Administrator can clear (using the kill option)
such agents after the problem is investigated.
Stopping and
starting are normal transitory states, which are self-explanatory.
|
|
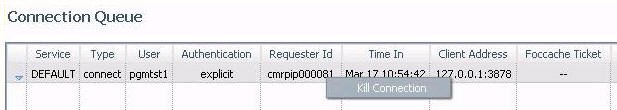
Client Information
|
|
User
|
User ID associated with the server connection.
|
|
Group
|
Group ID associated with the server connection.
|
|
Client Session
|
Session ID uniquely identifying the client
session.
|
|
Client Address
|
For some protocols, the network address
of the connected client.
|
|
Code Page
|
Character code page used by the client connected
to the session.
|
|
Defer ID
|
Unique identifier assigned to the submitted
deferred request.
|
|
Scheduler Job ID
|
Unique identifier assigned to the last submitted
scheduled or CMASAP request.
|
|
FOCUS Information
|
|
Query Time
|
Last time that a request to the agent was
made. This value is used to calculate the time that an agent is
idle, in cases in which an idle agent limit was
set.
|
|
Command
|
First eight characters of the last instruction
executed by the data access agent.
|
|
Procedure
|
Displays the procedure currently being executed
or completed by each agent. For example, when a procedure, which
is a part of a job, executes another procedure, the name of this
procedure is shown in a Procedure column.
|
|
Top Level Procedure
|
Displays calling procedures or calling flows
executed or submitted by agents.
Note: This column
is not shown by default on the Data Services Agents page. To display
it, click Choose Columns, select its check
box on the Select the columns that will appear on the Agents page,
and click OK.
|
|
Master File
|
Name of the last Master File that was processed
by the agent. The displayed name can be up to 64 characters.
|
|
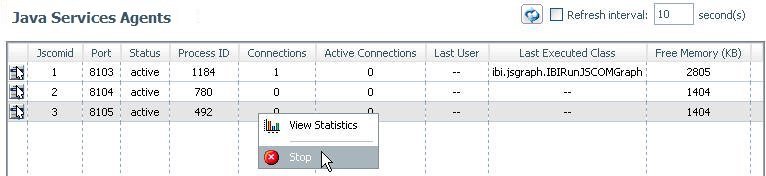
Executed Class
|
Last Java class executed. This value includes
explicitly called Java classes (such as CALLJAVA), and implicitly
called classes (such as GRAPH FILE).
|
|
Response Time
|
Time from the moment that the server receives
the request (regardless of the requesting tool, that is, Web Console, DataMigrator,
or WebFOCUS) until the request completes and the response is sent
to the requester.
|
|
Server Time
|
Response time minus DBMS processing time.
|
|
Error Number
|
Last &RETCODE that is set upon procedure
(FOCEXEC) completion. Zero (0) is normal. Any other value indicates
an abnormal completion.
|
|
Focus I/O
|
Number of FOCUS I/O operations performed
by the agent.
|
|
Foccache Ticket
|
Unique identifier assigned to the last request
that used the foccache directory.
|
|
Number of Transactions
|
Number of transactions or HLI commands performed
by the agent.
|
|
Adapter Information
|
|
DBMS I/O
|
Number of external I/O operations performed
by the agent.
|
|
DBMS Time
|
Amount of DBMS processing time in seconds.
|
|
Change Data Capture Information
|
|
Source DBMS Adapter
|
Suffix of the listening adapter.
|
|
Source Table Name
|
Data source that is listened on.
|
|
Status
|
Current status of the adapter.
|
|
Processed Transactions
|
Number of processed LUWs (files).
|
|
Polling Interval
|
Interval at which polling takes place.
|
|
Timeout Interval
|
Amount of time during which there is no
activity, and after which a timeout occurs.
|
|
Transactions Processing Limit
|
Maximum number of LUWs (files) that are
processed by the adapter in one request.
|
|
File Listener Information
|
|
Source File Type
|
Suffix of the listening adapter.
|
|
Source Directory (File)
|
Data source that is listened on.
|
|
File Extension
|
Extension of processed files.
|
|
Status
|
Current status of the adapter.
|
|
Processed Files
|
Number of processed LUWs (files).
|
|
Processed Bytes
|
Number of bytes processed by the file listener
adapter.
|
|
Files in wait queue
|
Number of selected files waiting to be processed
by the file listener adapter.
|
|
Processing time
|
Rounded number of seconds that the file
listener adapter spent in processing files.
|
|
Wait for work time
|
Rounded number of seconds that the file
listener adapter spent in waiting for files.
|
|
Average files per second
|
Average number of files per second that
the file listener adapter processed.
|
|
Average bytes per second
|
Average number of bytes per second that
the file listener adapter processed.
|
|
Average file wait time
|
Average time in seconds that the file listener
adapter spent in waiting for files.
|
|
Polling Interval
|
Interval at which polling takes place.
|
|
Timeout Interval
|
Amount of time during which there is no
activity, and after which a timeout occurs.
|
|
Files Processing Limit
|
Maximum number of LUWs (files) that are
processed by the adapter in one request.
|
|
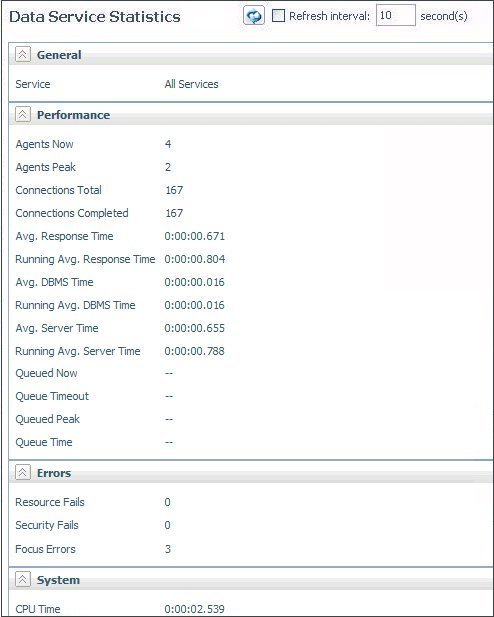
System
|
|
CPU Time
|
Total CPU time used by the process.
|
|
Memory Usage (KB)
|
Amount of memory, in kilobytes, used by
the process.
|
|
Disk Usage (KB)
|
Disk space, in kilobytes, used by the process.
|
|
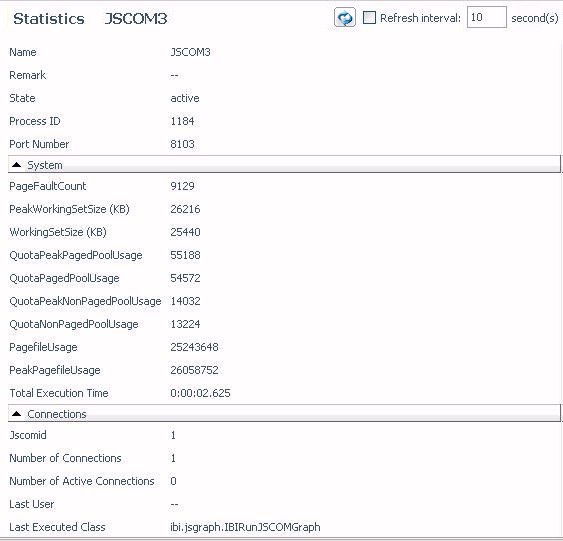
Process ID
|
Operating system specific process identification
number that is associated with the agent.
|
 icon
on the Web Console menu bar. In the Session Log, you can click the message
to see expanded information, including troubleshooting suggestions.
For example:
icon
on the Web Console menu bar. In the Session Log, you can click the message
to see expanded information, including troubleshooting suggestions.
For example: 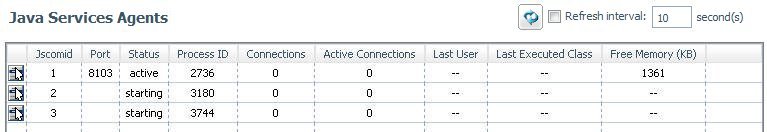
 button.