In this section: |
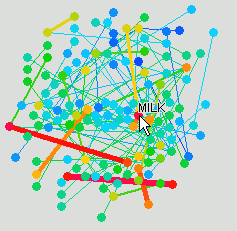
Data constellations, or constellation graphs, depict multiple data sets or groups of data sets with particular attributes and map the association between them. They are called constellations because they are made up of numerous stars or nodes. Each represents a specific data value that is distanced from and connected to each other on the diagram plane in proportion to the strength or weakness of their relationship. Data constellations are best suited for plotting and analyzing large, complex data sets in a single view. Additional data attributes and relationships can also be displayed by adjusting node and link size, style, and color based on data values.
The following image shows an example of a data constellation.

With WebFOCUS visualization features, you can fully understand and explore relationships by creating complete, easy-to-read data constellations. You can further enhance these constellations by:
Data constellations are a graphic representation that show relationships among data, using links that connect nodes. They can be helpful when you are analyzing, for example, hierarchical data, types of calls over a telephone system or help desk, order tracking for factory or retail distribution centers, or process characteristics related to product flaws where a node may represent a city or other location. Lines, in this case, can represent characteristics of a call, system problem, or production line environment variable.
Use data constellations when you have mixed data types and want to visualize and analyze three or more fields. While allowing you to analyze relationships among three or more objects, this component shows the strength of relationships (affinity) between and among items through node and link size and appearance, placement, and coloring. Different icons can be used with nodes or instead of nodes to provide more information about the categories of items within your data set.
Note: Data for data constellations must be prepared for this component. All data relationships must be defined in one file. A second input file contains information about the nodes. If your application has not been designed with these considerations in mind, you may not be able to explore the relationships you want. For an example, see Tutorial: Building a Visual Discovery Analytic Dashboard with Advanced Chart Controls or for more information, see Data Constellation Maps.
How to: |
In a data constellation, the link weight shows the strength of attraction between nodes, which is also accomplished using a field. This is used for placement and does not visibly change the graph.
| WebFOCUS |