WebFOCUS Chart and Graph Enhancements
You can include API calls in WebFOCUS procedures to
create dynamic, sophisticated graphs that showcase your business
data.
If you save a chart generated by a WebFOCUS procedure in JSCHART
format, you can produce a highly interactive HTML5 visualization
rendered directly in the browser.
If you save a graph generated by a WebFOCUS procedure in Scalable
Vector Graphics (SVG) or Portable Network Graphics (PNG) format,
you can produce a high quality image for display or print, with
advanced features provided by the API calls.
xColoring Data Text for Negative Values in HTML5 Charts
You can activate the chart.dataLabels.UseNegativeColor property
in order to display the data labels for negative values in the color
defined by the chart.dataLabels.negativeColor property.
You can activate this property in an HTML5 chart using the setUseNegativeDataTextColor(true); API
call.
Syntax:
void setUseNegativeDataTextColor(boolean);
where:
- boolean
Can be one of the following:
- true
Causes negative data labels to be displayed in the color
defined by the chart.dataLabels.negativeColor property. By default,
the color for negative data labels is red.
- false
Displays all data text in the same color (by default, black),
regardless of whether the value is positive or negative. This value
is the default.
Example: Displaying Red Data Labels for Negative Riser Values
The following request against the GGSALES
data source calculates the difference between dollar sales and budgeted
dollars by category and displays the results as a bar chart. The graph
script portion of the StyleSheet includes the setDataTextDisplay(true);
API call.
DEFINE FILE GGSALES
DIFF/D12.2= DOLLARS-BUDDOLLARS ;
END
-DEFAULTH &WF_STYLE_UNITS='PIXELS';
-DEFAULTH &WF_STYLE_HEIGHT='405.0';
-DEFAULTH &WF_STYLE_WIDTH='770.0';
-DEFAULTH &WF_TITLE='WebFOCUS Report';
GRAPH FILE GGSALES
SUM DIFF
BY CATEGORY
ON GRAPH PCHOLD FORMAT JSCHART
ON GRAPH SET HTMLENCODE ON
ON GRAPH SET GRAPHDEFAULT OFF
ON GRAPH SET ARGRAPHENGIN JSCHART
ON GRAPH SET VZERO OFF
ON GRAPH SET UNITS &WF_STYLE_UNITS
ON GRAPH SET HAXIS &WF_STYLE_WIDTH
ON GRAPH SET VAXIS &WF_STYLE_HEIGHT
ON GRAPH SET GRMERGE ADVANCED
ON GRAPH SET GRMULTIGRAPH 0
ON GRAPH SET GRLEGEND 0
ON GRAPH SET GRXAXIS 1
ON GRAPH SET LOOKGRAPH VBAR
ON GRAPH SET AUTOFIT ON
ON GRAPH SET STYLE *

*GRAPH_SCRIPT
setPieDepth(0);
setPieTilt(0);
setDepthRadius(0);
setCurveFitEquationDisplay(false);
setPlace(true);
*END

INCLUDE=ENIADefault_combine.sty,$
TYPE=REPORT, TITLETEXT=&WF_TITLE.QUOTEDSTRING, $

*GRAPH_SCRIPT
setReportParsingErrors(false);
setSelectionEnableMove(false);
setUseNegativeDataTextColor(true);
setDataTextDisplay(true); *END
ENDSTYLE
END
On the chart, the label
text for risers with negative values are displayed in red, while
the label text for the positive riser is displayed in black.
xPlus and Minus Marker Shapes for HTML5 Charts
The marker shape, circlePlus, displays a circle with
a plus sign (+) centered in it, and the marker shape, circleMinus,
displays a circle with a minus sign (-) centered in it. The marker must
have a border for the plus and minus signs to show up.
Example: Displaying the circlePlus and circleMinus Marker Shapes in an HTML5 Chart
The following request against the GGSALES
data source charts dollar sales and units sold by category.
GRAPH FILE GGSALES
SUM DOLLARS UNITS
BY CATEGORY
ON GRAPH PCHOLD FORMAT JSCHART
ON GRAPH SET LOOKGRAPH VLINE
ON GRAPH SET STYLE *
*GRAPH_JS
mouseOverIndicator: {enabled: true,color: ' '},
introAnimation: {
enabled: true,
duration: 1000
},
series: [
{series: 0, marker: {shape: 'circlePlus', color: 'yellow', size: 14, border: {color: 'black', width:1 }}},
{series: 1, marker: {shape: 'circleMinus', color: 'yellow', size: 14, border: {color: 'black', width:1 }}}
]
END
The markers for dollar
sales are circles with a plus sign (+) centered in them (circlePlus marker
shape), and the markers for units sold are circles with a minus
sign (-) centered in them (circleMinus marker shape).
xSuppressing Data Text for Small Risers
The setAutoHideDataTextOnSmallRisers property, when
enabled, suppresses the display of data text if the height of the
riser is smaller than the height of the data text.
Syntax:
void setAutoHideDataTextOnSmallRisers(boolean);
boolean = getAutoHideDataTextOnSmallRisers();
where:
- boolean
Can be one of the following:
- true
Suppresses the display of data text that is larger than its
riser.
- false
Displays all data text regardless of the height of the riser.
This value is the default.
Example:
setAutoHideDataTextOnSmallRisers(true);
With setAutoHideDataTextOnSmallRisers(true),
the risers that are too small for data text do not have any text
in them.
setAutoHideDataTextOnSmallRisers(false);
With setAutoHideDataTextOnSmallRisers(false), the risers that
are too small for data text still have the text in them. The text
in the small risers overwrites text from other risers.
xMaking Y-Axis Labels Inherit the Region Color
The setAltFmtMatchAxisLabelColor property controls whether
Y-axis Labels associated with the alternate frame region inherit
the color specified for that region. When enabled, the labels are
colored with the color specified for the region. When disabled,
labels are displayed using the default color.
Syntax:
void setAltFmtMatchAxisLabelColor(boolean);
boolean = getAltFmtMatchAxisLabelColor();
where:
- boolean
Can be one of the following:
- true
Causes Y-axis labels to inherit the color of alternate frame
regions.
- false
Causes Y-axis labels to use the default color. This value
is the default.
Example:
The following request sets the setAltFmtMatchAxisLabelColor
property to true:
setDisplay(getY1AltFmtFrame(),true);
setAltFmtFrameNumColors(getY1AltFmtFrame(),2);
setAltFmtFrameSeparator(getY1AltFmtFrame(0),80.0);
setFillColor(getY1AltFmtLabel(0),new Color(0,0,0));
setFillColor(getY1AltFmtFrame(1),new Color(255,0,0));
setReferenceLineValueY1(0,80.0);
setLineWidth(getReferenceLineY1(0),2);
setFillColor(getY1AltFmtFrame(0),new Color(232,232,232));
setAltFmtMatchAxisLabelColor(true);
With setAltFmtMatchAxisLabelColor(true),
the Y-axis labels inherit the color red when the alternate frame
region is red and inherit the color grey when the alternate frame
region is grey.
Changing setAltFmtMatchAxisLabelColor()
to false, causes the Y-axis labels to use the default color, not
the colors of the alternate frame regions.
setAltFmtMatchAxisLabelColor(false);
xAutomatic Color Rendering and Styling of Graph Risers
There are two methods you can use to automatically render
the color and style of graph risers:
-
Repeated Shading. You can automatically shade successive
groups of risers by lightening or darkening the colors used for
the risers in the previous group. This type of shading is implemented
using color mode 4, a looping index, and a factor for lightening or
darkening the colors.
-
Gradient Coloring. You can automatically create a gradient
effect between the colors for the first and last risers by defining
a starting color and ending color for the risers. This type of coloring
is implemented using color mode 5, a starting color, and an ending color.
x
Syntax: How to Implement Automatic Repeated Riser Shading
You
can automatically shade groups of risers by lightening or darkening
the color values in each successive group. You implement this type
of shading by setting the color mode to 4, setting a looping index
equal to the number of risers in each group, and setting an automatic color
lightening or darkening factor:
setColorMode(4);
setSeriesLooping(s);
setAutoColorLerpFactor(f);
where:
- setColorMode(4);
Implements automatic repeated riser shading.
- s
Identifies the number of risers in each group on the graph.
- f
Is a double-precision number between -1 and 1 that represents
the factor for lightening or darkening each successive group of
risers. A positive factor specifies that each successive group of
risers will be lighter than the previous group. A negative number specifies
that each successive group of risers will be darker than the previous
group. Zero indicates that each successive group of risers will
be shaded exactly the same as the previous group.
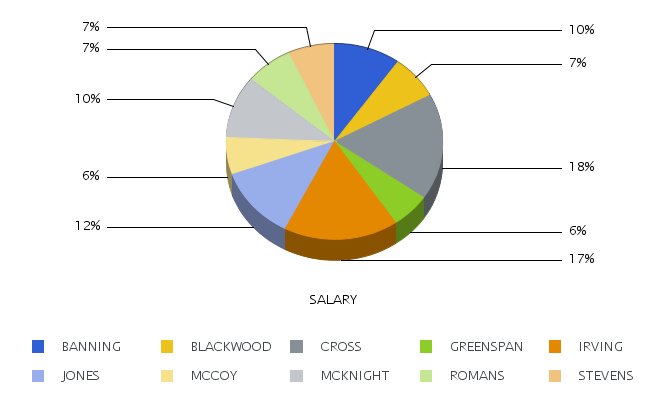
Example: Implementing Automatic Repeated Riser Shading in a Pie Chart
The following implements repeated lightening
of groups of risers. It sets the color mode to 4, the series looping
index to 5, and the automatic color factor to 1:
-*Autoshade base on every 5 series
setColorMode(4);
setSeriesLooping(5);
setAutoColorLerpFactor(1);
-*
ENDSTYLE
ON GRAPH SET STYLE *
INCLUDE=IBFS:/CFG/FILE/IBI_HTML_DIR/javaassist/intl/EN/ENIADefault_combine.sty,$
ENDSTYLE
END
On the output, the riser
colors repeat after five car values because the looping index is
5:
- The riser color for JONES is a lighter version of
the riser color for BANNING.
- The riser color for MCCOY is a lighter version of the riser
color for BLACKWOOD.
- The riser color for MCKNIGHT is a lighter version of the riser
color for CROSS.
- The riser color for ROMANS is a lighter version of the riser
color for GREENSPAN.
- The riser color for STEVENS is a lighter
version of the riser color for IRVING.
x
Syntax: How to Implement Automatic Gradient Riser Coloring
You
can automatically create a gradient color effect between the risers
in a graph. You implement this type of coloring by setting the color
mode to 5, setting a starting color for the gradient, and setting
an ending color for the gradient:
setColorMode(5);
setAutoColorGradientStartColor({Color.start_color|new Color(r1,g1,b1)});
setAutoColorGradientEndColor({Color.end_color|new Color(r2,g2,b2)});
where:
- setColorMode(5);
Implements automatic gradient riser shading.
- start_color
Identifies the starting color for the gradient.
- (r1,g1,b1)
Is the code for the red, green, and blue components of the
starting color.
- end_color
Identifies the ending color for the gradient.
- (r2,g2,b2)
Is the code for the red, green, and blue components of the
ending color.
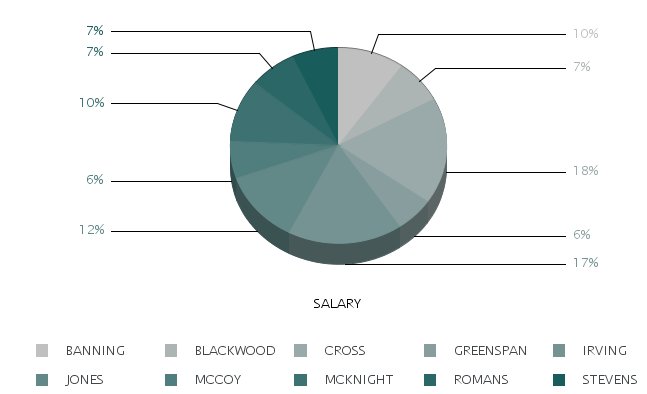
Example: Implementing Automatic Gradient Riser Coloring
The following implements automatic gradient
riser coloring. It sets the color mode to 5, the start color to
dark gray (192,192,192) and the end color to green (25,92,92):
-*Gradient effect
setColorMode(5);
setAutoColorGradientStartColor(new Color(192,192,192));
setAutoColorGradientEndColor(new Color(25,92,92));
-*
ENDSTYLE
ON GRAPH SET STYLE *
INCLUDE=IBFS:/CFG/FILE/IBI_HTML_DIR/javaassist/intl/EN/ENIADefault_combine.sty,$
ENDSTYLE
END
On the output, the riser
colors form a gradient from the start color (dark gray) to the end color
(green):
xCustom ToolTip for Server-Side Graphs
You can customize text that appears in a ToolTip when
hovering over chart risers.
xSetting the Color of the Page Surrounding the Graph
Graph functionality has been enhanced to allow setting
the color of the HTML page that surrounds the image directly from
the graph procedure.
xOutput Format for Embedding GIF Images Into PDF
GIF graph images can be embedded into a PDF document
by using output format PDF/GIF.