Syntax: How to Show Data Text Labels for Series and Groups
series:
[
    (
      series: snumber,
      group: gnumber,
      showDataValues: boolean,
   }
]
where:
- snumber
Is a zero-based series number. If the series does not exist in the chart, the property is ignored.
- gnumber
is an optional zero-based group number. If the group does not exist in the chart, the property is ignored. If a group number is not specified, the property definition is applied to all risers in the series.
- boolean
Enables or disables data text labels for individual series or groups when the dataLabels: visible property is true. Valid values are:
- true, which enables data text labels.
- false, which disables data text labels. This is the default value.
Example: Enabling and Disabling Data Text Labels for Series and Groups
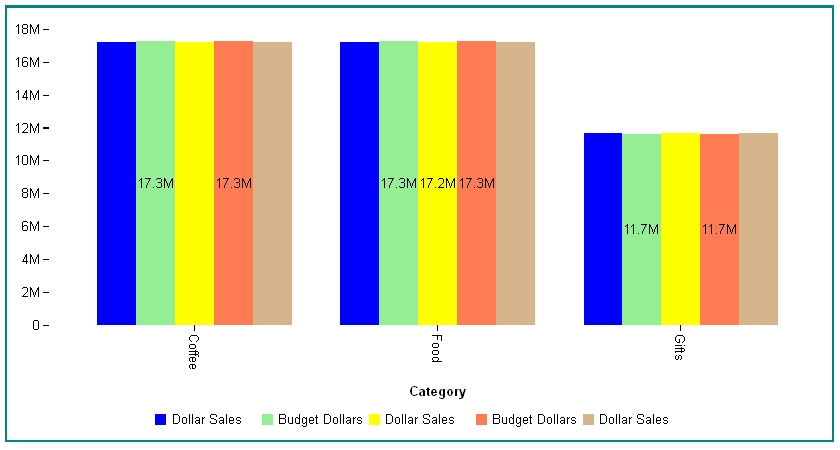
The following request against the GGSALES data source generates data text labels for series 1 and 3 and for group1 in series 2:
GRAPH FILE GGSALES
SUM  DOLLARS BUDDOLLARS DOLLARS BUDDOLLARS DOLLARS
BY CATEGORY
ON GRAPH PCHOLD FORMAT JSCHART
ON GRAPH SET LOOKGRAPH VBAR
ON GRAPH SET STYLE *
*GRAPH_JS
  border: {width: 2, color: 'teal'},
   dataLabels: {visible:true},
  series: [
   {series: 0,color: 'blue', showDataValues:false},
   {series: 1, color: 'lightgreen',  showDataValues:true},
   {series: 2, color: 'yellow'},
   {series: 2, group: 1,  color: 'yellow',  showDataValues:true},
   {series: 3, color: 'coral',  showDataValues:true},
    {series: 4, color: 'tan',  showDataValues:false}
]
*END
ENDSTYLE
END
The output is:
