Syntax: How to Define the Color Scale in a Treemap, Heatmap, or Tagcloud Chart
yaxis:
{
  colorScale: {
    colors: ['color1', 'color2', ..., 'colorn']
  }
},
where:
- ['color1', ...,'colorn']
Is an array of colors defined by a color name or numeric specification string. The default value is: ['#253494', '#2C7FB8', '#41B6C4', '#A1DAB4'].
Example: Defining a Color Scale
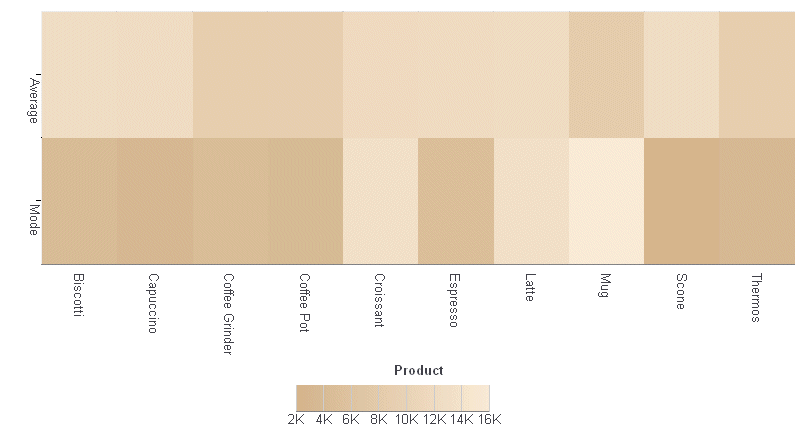
The following request against the GGSALES data source generates a heatmap chart with a color scale consisting of the colors tan and antique white:
GRAPH FILE GGSALES
SUM AVE.DOLLARS AS 'Average'
 MDE.DOLLARS AS 'Mode'
BY PRODUCT
ON GRAPH PCHOLD FORMAT JSCHART
ON GRAPH SET LOOKGRAPH SPECTRAL
ON GRAPH SET STYLE *
*GRAPH_JS
   yaxis: {mode: 'color', colorScale: {colors: ['tan', 'antiquewhite'] }}
*END
INCLUDE=ENIADefault_combine.sty,$
ENDSTYLE
END
The output is:

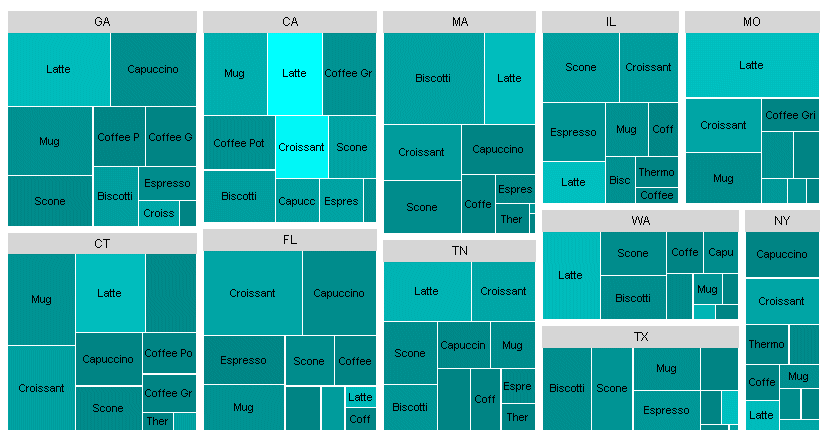
The following request against a join between the GGSALES and GGSTORES data sources generates a treemap chart with a color scale consisting of the colors teal and cyan:
JOIN STCD IN GGSALES TO STORE_CODE IN GGSTORES AS J1
DEFINE FILE GGSALES
PROFIT/D12.2= DOLLARS-BUDDOLLARS ;
END
GRAPH FILE GGSALES
SUM PROFIT UNITS
BY ST
BY PRODUCT
ON GRAPH PCHOLD FORMAT JSCHART
ON GRAPH SET LOOKGRAPH TREEMAP
ON GRAPH SET STYLE *
*GRAPH_JS
yaxis: {mode: 'color', colorScale: {colors: ['teal','cyan']}}
*END
ENDSTYLE
END
The output is:
