swapDataAndLabels: booleanwhere:
- boolean
Can be:
true, which swaps the series, group, and label orientation.
false, which does not swap the series, group, and label orientation. This is the default value.
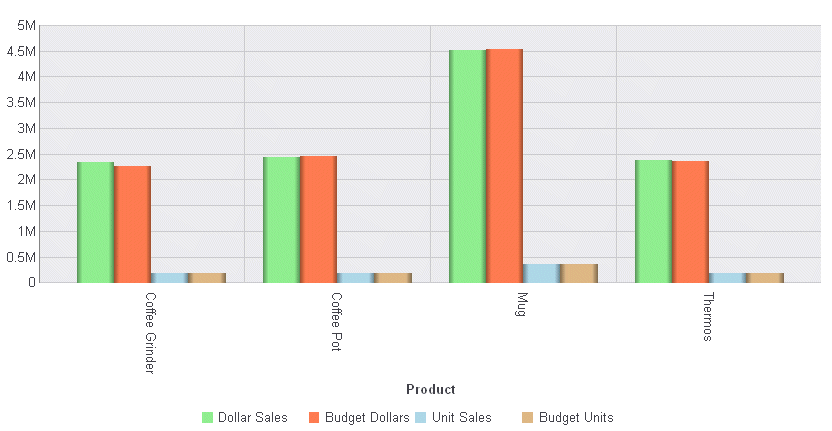
The following request against the GGSALES data source generates a vertical bar chart:
GRAPH FILE GGSALES
SUM DOLLARS BUDDOLLARS UNITS BUDUNITS
BY PRODUCT
WHERE CATEGORY EQ 'Gifts'
ON GRAPH PCHOLD FORMAT JSCHART
ON GRAPH SET LOOKGRAPH VBAR
ON GRAPH SET STYLE *
*GRAPH_JS
    swapDataAndLabels:false,
series: [
    {series: 0, color: 'lightgreen'},
    {series: 1, color: 'coral'},
    {series: 2, color: 'lightblue'},
    {series: 3, color: 'burlywood'}
]
*END
INCLUDE=ENIADefault_combine.sty,$
ENDSTYLE
END
On the output:
- The first set of bars represents all series (DOLLARS, BUDDOLLARS, UNITS, and BUDUNITS) values for the first group value (PRODUCT Coffee Grinder).
- The second set of bars represents all series values for the second group value (PRODUCT Coffee Pot).
- The third set of bars represents all series values for the third group value (PRODUCT Mug).
- the fourth set of bars represents all series for the fourth group value (PRODUCT Thermos).

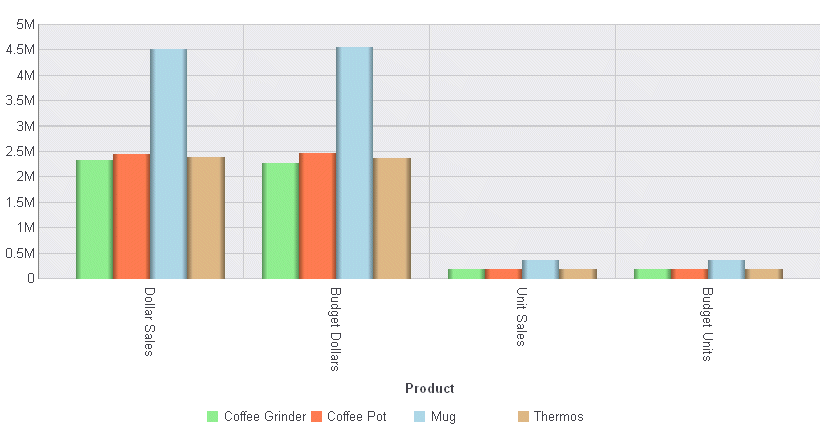
Changing the swapDataAndLabels property to true generates the following chart, in which:
- The first set of bars represents DOLLARS (series 0) for each product (group) value.
- The second set of bars represents BUDDOLLARS (series 1) for each product (group) value.
- The third set of bars represents UNITS (series 2) for each product (group) value.
- The fourth set of bars represents BUDUNITS (series 3) for each product (group) value.
The labels have also been swapped, to represent the new orientation:
