The following table lists the types of calculations in the first column and describes their functions in the second column.
|
Calculation |
Function |
|---|---|
Average Sum of Squares |
Computes the average sum of squares for standard deviation in statistical analysis. |
Average |
Computes the average value of the field. |
Count |
Counts the number of occurrences of the field. |
Count Distinct |
Counts the number of distinct values within a field when using -REMOTE. For other modes of operation, this behaves like Count. |
Maximum |
Generates the maximum value of the field. |
Minimum |
Generates the minimum value of the field. |
Percent |
Computes the percent of a field based on the total values for the field. The Percent can be used with detail, as well as summary fields. |
Percent of a Count |
Computes the percent of a field based on the number of instances found. |
Row Percent |
Computes the percent of a field based on the total values for the field across a row. |
Summarize |
Sums the number of occurrences of the field. |
Total |
Counts the occurrences of the field for use in a heading (includes footings, subheads, and subfoots). |
The following is an example of applying a percent calculation to a measure.
- Run OLAPREP6.
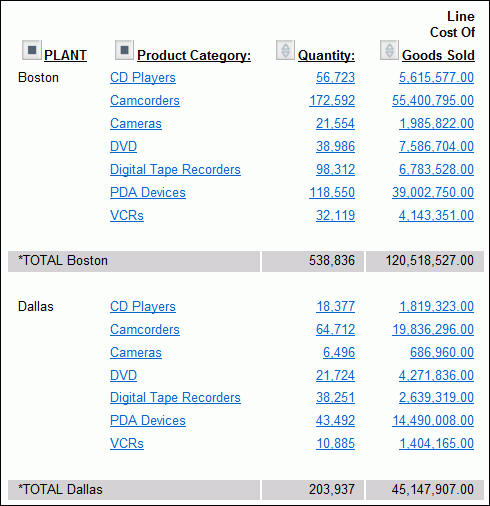
The report shows Quantity and Line Cost of Goods Sold sorted by plant and product category, with a subtotal at each sort break.
You want to create a report column that shows the percent of total sales for each plant.
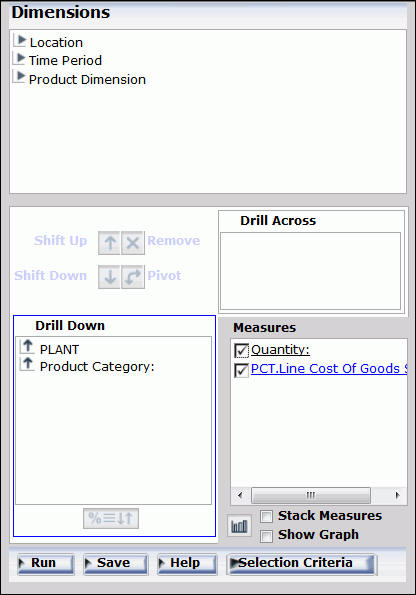
- Click the square icon next to PLANT to open the OLAP Control Panel.
- Click Line
Cost of Goods Sold in the Measures pane.
The sort pane opens.
- Select the Sort check box, and select the High to Low option button to specify the sort order.
- Under Measure
Calculations, choose Percent from the drop-down
list, as shown in the following image.
- Click Ok to
see the calculation as a prefix for the measure in the Measures
pane as shown in the following image.
- Click Run at
the bottom of the OLAP Control Panel.
The report now breaks down sales for each product at each plant as a percentage of total sales, as shown in the following image.
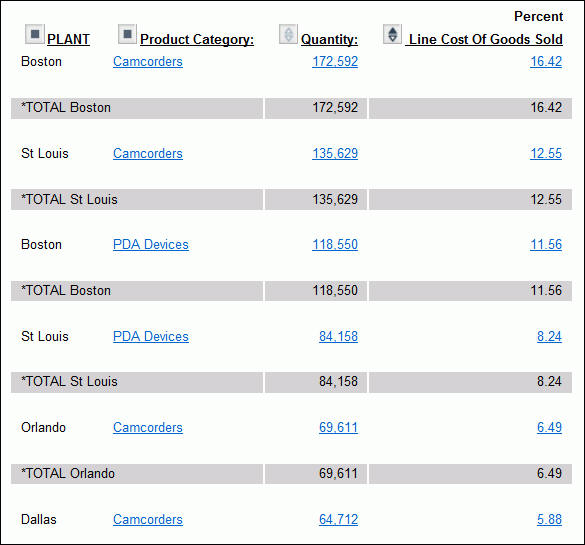
Notice that the subtotals have been removed from the report because the breakdown by plant is no longer suitable for the data.