Using Additional Formatting Features
This section describes additional formatting features
that are available for charts.
x
Procedure: How to Set 3D Depth on a Bar Chart
You
can apply a 3D-effect to a 2D-chart.
Note: If
you find that the depth of the 3D effect makes it difficult to distinguish
the values on the Y-axis scale, then you can turn this option off.
This procedure explains how to set the 3D effect for a default vertical
bar chart.
The following image shows a bar chart before the
3D effect is applied.
-
Create a
2D chart.
-
In Live
Preview, apply the 3D effect in one of the following ways:
-
Ribbon: On
the Format tab, in the Features group, click 3D Effect.
-
Right-Click Menu: Right-click
the frame of the chart, point to Show 3D, and select On,
as shown in the following image.
The
3D effect is applied to the chart, as shown in the following image.
x
Procedure: How to Rotate a Chart
You
can rotate bar, line, and area charts to change the orientation
of the data.
The following
image shows a vertical chart before it is rotated.
-
Create a chart.
-
On the Format tab, in the Features group, click Rotate.
The chart is rotated 90 degrees clockwise. The following
is an example of the same chart above, now rotated.
x
Procedure: How to Display a Static Reference Line
Reference
lines draw attention to specific data locations on a chart. You
can add up to three horizontal (X axis) and three vertical (Y axis)
reference lines to a chart.
In InfoAssist, reference lines
can be created using either a constant or a computed field.
Field
values allows a property to be dynamic, so that the reference line
can change position dynamically on the chart depending on the value
of the field that is assigned to it.
Note: A reference
line value should be a single value, such as 10K, for example. In
the Reference line dialog box, if you select a field with multiple
values, (Quantity Sold, for example), then InfoAssist plots the
last value on the chart.
-
Create a chart.
-
On the Format tab, in the Features group, click Reference.
-
In the drop-down menu that opens, select one of the following:
- Add Reference
Line to Y axis
- Add Reference
Line to X axis
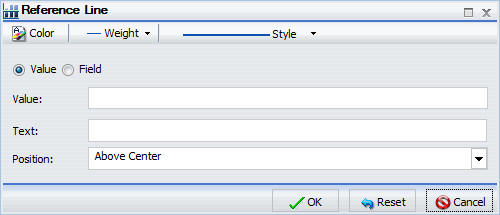
The Reference Line dialog box opens, as shown in
the following image.
-
Create the reference line with a static value that you set.
-
Select the Value option.
-
In the Value text field, type the value that you want to distinguish with
the reference line.
-
In the Text field, type the text for the reference line.
-
In the Position drop-down menu, select the position for the
reference line on the chart.
The options are:
- Above Center (default)
- Above Left
- Above Right
- Below Center
- Below Left
- Below Right
-
Click the Style button to set the style
for the reference line. The options are:
- Solid (default)
- Dots
- Many Dots
- Dashed
- Dashed Dots
- Long Dash
- Mixed Dashes
-
Click the Color button
to open the Color dialog box, where you can select a color for the
reference line and the text.
-
Click the Weight button
to select the weight of the reference line. The options are:
- 1px - Light
(default)
- 2px - Medium
- 3px - Heavy
-
Click OK to
save the options that you have selected, and close the Reference
Line dialog box.
The reference line is added to the chart.
The following
image shows a bar chart with a Y-axis reference line. The reference line
was added by typing 120 in the Value field, and Top Selling Product
in the Text field. The reference line uses the default Above Center
setting for position. It is formatted as a red, dotted line, of
medium weight.
x
Procedure: How to Display a Dynamic Reference Line
In
InfoAssist, reference lines can be created using either a constant
or a computed field.
Field
values allows a property to be dynamic, so that the reference line
can change position dynamically on the chart depending on the value
of the field that is assigned to it.
Note: A reference
line value should be a single value, such as 10K, for example. In
the Reference line dialog box, if you select a field with multiple
values, (Quantity Sold, for example), then InfoAssist plots the
last value on the chart.
The following procedure provides
an example of how to create a dynamic reference line, where the
value changes based on the date. In this example, you can track
the number of estimated delivery days per shipping company, where
the number of days estimated for delivery are based on whether or
not the sale date is a holiday.
-
Create a
COMPUTE field to calculate the Reference Line.
-
On the Data tab, in the Calculation group, click Summary
(Compute).
The Summary Field (COMPUTE) dialog box opens.
-
In the Field text box, enter Reference.
-
Set the format to 12.
-
Enter IF WF_RETAIL.DIM_TIME_SALES.TIME_HOL EQ 'Y'
THEN 5 ELSE 2 into the expression.
-
Click OK to close the dialog box.
-
Hide the Reference field
from the chart.
-
Add a dynamic
reference line.
-
On the Format tab, in the Features group, click Reference.
-
From the drop-down menu, select Add Reference Line
to Y-Axis.
The Reference Line dialog box opens.
-
Select the Field option.
-
From the Field drop-down menu, select Reference.
-
In the Text field, enter Acceptable.
-
From the Weight drop-down menu, select 2px - Medium.
-
From the Position drop-down menu, select Above Left.
-
Optionally, you can change the color and style of the Reference line.
-
Click OK to close the Reference Line dialog
box.
-
Run the
chart.
Auto Prompt appears, as shown in the following image.
-
Select 20100101 (January 1, 2010) and
click Run to see that five days are acceptable
since the date is a holiday.
-
Select 20100202 (January 2, 2010) and
click Run again to see that two days are
acceptable since the date is not a holiday.
-
Click Save.
x
Procedure: How to Display Annotations
Annotations
are explanatory notes or comments. You can add up to eight annotations on
a chart.
-
Create a chart.
-
On the Format tab, in the Features group, click Annotate.
-
In the drop-down menu that opens, click Add an annotation.
The Annotation dialog box opens, as shown in the
following image.
-
In the text input field, type the text for the annotation.
-
In the Position drop-down menu, select the position for the
annotation on the chart. The options are:
- Top Left
- Top Middle
- Top Right
- Middle Left
- Middle Right
- Bottom Left
- Bottom Middle
- Bottom Right
-
Click OK to
save the options that you selected, and close the Annotation dialog
box.
The annotation is added to the chart.
-
Click Run to generate the report.
The following image shows a chart with an annotation in
the middle right position.