In this section: |
As you create or modify a report, the Results panel displays the Layout canvas in the default Live Preview, or in the Query Design pane when you select Query Design view. When you execute a report, the Results panel displays the Output window. If the Output window is closed, or if there is no report to preview, the Results panel is blank. You can select Query Design view or Live Preview from the Design group of the View tab or Home tab.
The following image shows the Results panel, which displays a chart preview when you first launch InfoAssist to create a chart. The Resources panel appears to the left of the Results Panel.
After executing a report to generate output, if you minimize or close the Output window, the Results panel displays empty space.
The Query Design pane displays the Filter area, and the Query field containers. The Query Design pane appears in the Resources panel below the Data pane when you select the default Live Preview.
The Results panel provides a larger area for displaying the Query Design pane. This feature is useful when you are designing a report with multiple filters or numerous fields. You can select Query Design view or Live Preview on the Home tab, in the Design group, or on the View tab, in the Design group.
The following image shows the Query Design pane in the Results panel of the InfoAssist application window. It is displaying report field containers that include Filter, Sum, By, and Across.
Depending on whether you are creating a report or a chart, the Query Design pane displays selected data source fields using different types of field containers.
For reports, the Query Design pane displays Column Labels, Row Labels, and Measures field containers.
For charts, the Query Design pane displays Filter, Legend (Series), Categories (Axis), and Measures (Sum) field containers, as shown in the following image.
The Layout canvas displays a preview of the report being created or modified in the Results panel when you are in the default Live Preview. To select Live Preview, go to Home tab, and in the Design group, click Live Preview, or on the View tab, in the Design group, click Live Preview. The Layout canvas is always fully maximized (within the Results panel) and cannot be minimized, cascaded, or tiled. However, a blank canvas opens when there is no report.
The Layout canvas displays either live data or sample data.
The Layout canvas displays live data if, on the Home tab, in the Design group, you have clicked Data from Source (default).
The Layout canvas displays sample data if, on the Home tab, in the Design group, you have clicked Use Sample Data.
When you select Data from Source, a live preview of the report being built is refreshed in the Layout canvas as you add, remove, and style data source fields in the report.
When you select Use Sample Data, the Layout canvas displays sample data based on the field type, with the same formatting and styling used to display live data.
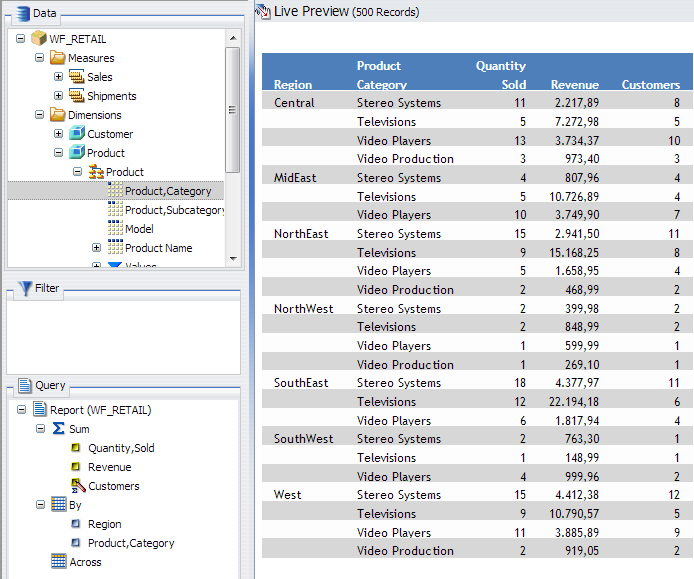
The following image shows a preview of a report displayed in the Layout canvas in Live Preview.
When working with a report in Live Preview, you can rearrange the columns of the report by dragging them to the left or right, depending on your display preference. If the column is numeric, you are presented with the option to Drop as Sum or Drop as Sort, as shown in the following image.
Note: If you select Drop as Sort, the values are listed individually and they are sorted. If you select Drop as Sum, the values are summed for that particular row. The default is Drop as Sum.
When placing the column in a new location, a red indicator bar displays, indicating the location of placement for the moved column. This allows you to see where the column will be placed before you actually perform the operation. This is shown in the following image.
Note: Column sort order can also be rearranged by dragging the fields in the field containers of the Query Design pane to reorder them. For more information, see Using the Query Design Pane in the Resources Panel.
If you create a filter, then the filter appears in the Filter pane and the Create Report drop-down menu appears at the bottom of the Results panel in Live Preview, as shown in the following image.
Open the menu to access the available options, as shown in the following image.
Reference: |
When you run a report, the output appears, either in a tab in the Results panel, or in a new browser window. You can create and display output in several different ways, depending on the following options. You can select these options on the View tab, in the Output Window group:
Output window and tab options are also available in the status bar, and output window display options are also available in the Navigation taskbar.
Note: When you run a report, tab focus is not on the output window and pressing the Tab key does not move the selection. To move the Tab focus out of the output window, press F6.
The following are output target options that you can select.
The following are output view options (Arrange) that you can select.

The Output window can display report output in the following formats HTML, HTML5, active report, active Flash, PDF, and active PDF.
Note: Excel and PowerPoint formats open in their native programs in a window external to InfoAssist.
The following image shows the HTML report output, which is the default output format, as displayed in the Output window. The Resources panel appears on the left.
The following image shows the active report output displayed with an output location of a new window. The drop-down menu for the last column of data exposes the reporting options.
The following image shows the active Flash output displayed with an output location of a new window.
The following image shows a PDF report output displayed with an output location of a new window.
The following image shows an active PDF report output displayed with an output location of a new window.
Note: The active PDF output can only be displayed if you have Adobe Reader 9.0 or later.
The following image shows an Excel report output displayed with an output location of a new window.
The following image shows a PowerPoint report output displayed with an output location of a new window.
| WebFOCUS |