Customizing the Map Properties

How to:

You may customize the map by using the Properties and settings dialog box and the Properties window.


Top of page

x
Reference: Properties and Settings Dialog Box for Maps

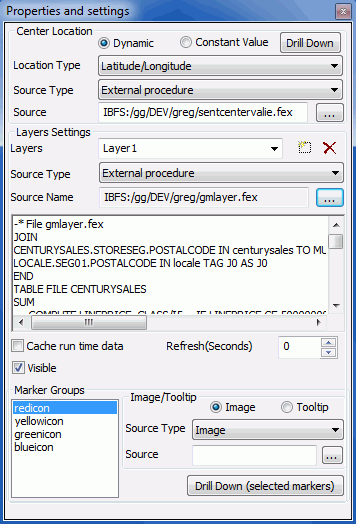
The following image is the Properties and settings dialog box that opens when you create a map object.

Center Location

Sets the center view of the map to a bound geographical point at run time. The center location can be set dynamically or by a constant value.

  • Dynamic. If these values are being retrieved from an external source, the source must contain two fields called LATITUDE and LONGITUDE, or if using an Address, a field called ADDRESS.

    Select a Source Type and a Source. This binds a Source file that contains coordinates to set the center view of the map.

    An external file should only return one Latitude and Longitude value for the center point.

    You can use the ASNAME command to rename an existing field to the required names.

  • Constant value. Manually type in a center value.
Location Type

Geographical position can be defined by Latitude or Longitude, or by an address.

The default is Latitude or Longitude.

Note: A Center Location, using address as the Location Type, is not supported when using an ESRI JavaScript map.

Source Type

When using a Dynamic center value, select the source of your location data. Source Type options are URL, XML File, and External procedure.

If using an External procedure, the report output must be XML.

Source

When using a Dynamic center value, enter the source file for the source type.

The Source field provides an ellipsis button when using XML files and External procedures. Select the source file from the Get source file dialog box.

Value

When using a constant value, enter the Address or Latitude and Longitude value.

If entering a Latitude or Longitude value, the value entered should be Latitude and then Longitude, separated with a comma (and/or space).

If entering a Latitude and Longitude value, it must be defined as a numeric value. For example, the following is latitude and longitude for New York, NY 10001:

40 45’ 58.73” N, 73 59” 1.48” W and converts to 40.7663277, -73.9920777.

An example of an Address value is: 2 Penn Plaza New York, NY 10001.

Layers Settings

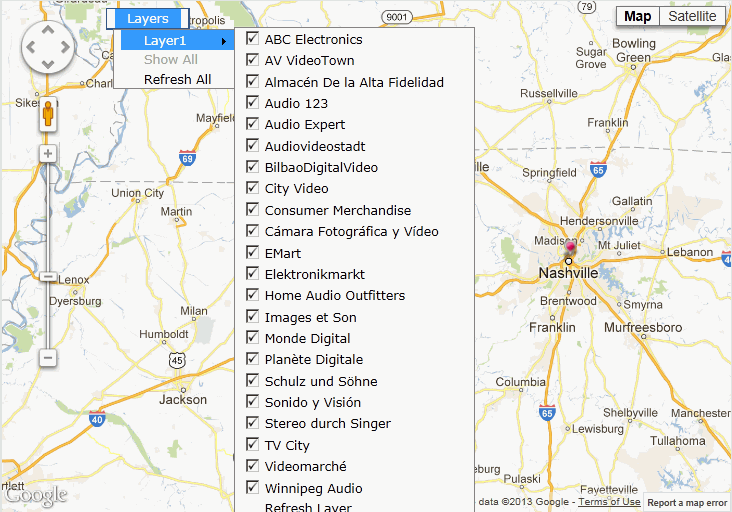
Layers bind sources to the map in order to define map markers. Markers are presented at run time in the map, as indicated with images at specified geographical points. Clicking the map marker results in a drill down to a Source file and optionally, a Tooltip when pausing on a map marker.

Select a Source Type, Source and Marker. Each Layer row will yield a designated marker in the Marker Groups box. Optionally, a selected marker can be associated with an Image, Drill Down, and Tooltip.

Layers

You can rename the layers by typing in the Layers box. This name should be a unique name that is used to identify a layer in the layer control and in JavaScript calls.

Note: A default name of Layer1, Layer2, and so on, is applied when you click the Add New button. You may double-click in the field and manually type in a unique name.

Source Type

Select the source of your layer. Source Type options are URL, XML File, and External procedure.

If using an External procedure, the report output must be XML.

Source Name

Enter the source file for the source type.

Note: The Source field provides an ellipsis button which enables you to select the source file from the Get source file dialog box.

When the source is selected, the Marker Groups box is populated with the values from the field, MARKER, in the WebFOCUS procedure.

Cache run time data

When adding dynamic parameters to the HTML page, input controls retrieve data through procedures. Select this option to cache the run-time data for the selected input control. This setting is off by default. This setting overrides the Default caching option from the HTML Page tab, which is located in the Developer Studio Options dialog box.

Visible

Controls the initial visibility of the marker groups, from the layer control, when the map runs. The visible option is useful when you want to make selections on the map without other markers, from other layers, interfering. For example, when making selections and doing a drill down, only visible markers should be selected and passed along.

  • True shows the marker groups when the map runs. This is the default visible setting.
  • False hides the marker groups when the map runs.
Refresh (Seconds)

You can refresh the source for a layer when the map runs. You may refresh a layer on demand, or automatically, at a timed interval. The default refresh time is set to 0 (zero) seconds, which indicates that the automatic refresh is disabled. The minimum automatic refresh time is 60 seconds.

Refresh is not applicable to markers in the Marker Groups.

For more information about refreshing a map, see How to Refresh the Map Output.

Marker Groups

The Marker Group box lists all unique markers defined in the source of the highlighted source row. When the source is selected, the Marker Groups box changes, listing all markers in the selected Layer. Optionally, a selected marker can be associated with an Image, Drill Down, and Tooltip.

The possible values for markers are generated by previously defined fields in the Layer source. For more information about defining marker fields in a source, see Creating WebFOCUS Procedures for Maps.

Image/Tooltip

Select the Image and/or Tooltip to be associated for the selected marker.

  • Select an image to be used to mark a point on the map at run time.
  • When hovering over a map marker, a Tooltip containing a description of the selected map marker appears.
  • If you do not specify marker images, the default marker image (a green pin) is used.
Source Type
  • Images can be an image or a field.
  • Tooltips can be a constant value or a field.
Source

Enter the source field or constant value for the source type.

When the Source Type is Image, the Source field provides an ellipsis button which enables you to select the image file from the Get source file dialog box.


Top of page

x
Reference: Properties Window for Maps

The following image is the Properties window when a map object is selected.

Map: Bullseye Inner Ring

The inner ring radius is the distance between the center of the bullseye chart to the first ring, where 10 miles is the radius of distance.

Map: Bullseye Outer Ring

The outer ring radius is the distance from the center of the bullseye chart, where 100 miles is the radius of distance.

Map: Bullseye Rings

The number of rings to draw for the bullseye chart, where three rings is the default number of rings.

When you set the number of rings, the inner radius, and the outer radius, any rings between the innermost and the outermost ring, are proportionally separated.

Map: Default Type

Sets the default map rendered at run time. Select from Map/Road, Satellite/Bird’s Eye, or Hybrid/Automatic. Each option is presented as part of the map in the output, allowing you to change views.

  • Map/Road. Presents geographical borders and streets. This is the default map type.
  • Satellite/Bird’s Eye. Presents real imagery.
  • Hybrid/Automatic. Presents real imagery with borders and streets.

Note: Map, Satellite, and Hybrid are used for Google Maps while Road, Bird’s Eye, and Automatic are the equivalent for Bing Maps.

Map: dragging

Controls the ability to drag the map in order to reposition the center point to a new location. This option is set by default.

Note: This option cannot be disabled for Bing or ESRI maps. Selecting No from the drop-down list will not disable dragging.

Map: Menu Layers

The Layers menu control provides options to show or hide markers in the layers of the map, and manually refresh the layer(s).

Map: Menu Polygon

The New Polygon menu control provides options to select multiple markers on maps by creating shape selectors, such as a freehand polygon, rectangle, or bullseye chart.

You can select multiple markers on maps at run time by creating polygon shapes. Polygon features enable you to add both Tooltips and actions to all polygons when you pause on them in the map.

For details about how to create Polygon shape selectors in the map, see How to Create Polygons in the Map Output.

Map: Menu Run

The Run menu control runs the drill downs for the selected markers.

Map: Polygon Action Copy

Enables copying of a polygon.

Map: Polygon Action Delete

Enables deleting of a polygon.

Map: Polygon Action Move

Enables moving of a polygon.

Map: Polygon Action Resize

Enables resizing of a polygon.

Map: Polygon Tooltip Area

Tooltips appear when you pause on a shape selector in the map.

All Tooltip options are turned on by default.

Shows the Area Tooltip.

Map: Polygon Tooltip Dimensions

Shows the Dimensions Tooltip.

Dimensions appears as Radius (for a circle polygon shape) in the Tooltip.

Map: Polygon Tooltip Markers Count

Shows the Markers Count Tooltip.

Map: Selected Marker Image

Sets the icon or image associated with a marker when selected. Click the Selected Marker Image ellipsis button to open the Get source file dialog box and select a marker image. If you do not specify a selected marker image, the default selected marker image (a red bulb) is used.

Map: Units

Options for the location distance are miles (mi) or kilometers (km), where miles is the default unit selection.

Map: Zoom Continuous

Enables smooth, continuous zooming for select browsers.

Map: Zoom Double Click

Enables you to double-click to zoom in and out of the map.

Note: This option cannot be disabled for Bing maps. Selecting No from the drop-down list will not disable zooming when double-clicking.

Map: Zoom Level

Sets the default zoom level of the map at run time. The levels available are 0 through 18. If the zoom level is set to 8 or higher, the initial map will have only one point visible. The default value is 10.

You may also change the zoom level in the output with the scrolling and arrow buttons on the map.

Map: Zoom Scroll Wheel

Enables you to use the scroll wheel of your mouse to zoom in and out of the map.

Note: This option cannot be disabled for Bing maps. Selecting No from the drop-down list will not disable zooming using the scroll wheel.


Top of page

x
Procedure: How to Customize a Map

Customize the map by selecting the map and layer options.

  1. From the Properties and settings dialog box, select the starting center point for the map in the Center Location section.
    • If you are using a Dynamic value, select the Location Type, Source Type and a Source.

      Source Type options are URL, XML file, and External procedure. If you are using an External procedure, the report output must be XML.

      For example, select Dynamic, Latitude/Longitude from the Location Type drop-down list, and External procedure from the Source Type drop-down list. Click the Source ellipsis button to open the Get source file dialog box and double-click setcentervalue.fex as the external XML file. For details about the starting center point, see How to Create the Starting Center Point of the Map.

    • If you are using a Constant value, select the Location Type and enter the Value.

      An example of an Address value is: 2 Penn Plaza New York, NY 10001.

      If entering a Latitude and Longitude value, it must be defined as a numeric value. For example, the following is latitude and longitude for New York, NY 10001: 40 45’ 58.73” N, 73 59” 1.48” W and converts to 40.7663277, -73.9920777.

  2. To set the image for a selected marker at run time, in the Map: Selected Marker Image section of the Properties window, click the Source ellipsis button to open the Get source file dialog box, and select a marker image.

    For example, click the Source ellipsis button to open the Get source file dialog box and double-click purplepin.png as the marker image file.

  3. In the map control Properties window, Change the Zoom level to 6 and keep the other Default Map Type options.

    For more information about these properties, see Properties Window for Maps.

  4. From the Layers Settings section of the Properties and settings dialog box, bind one or more WebFOCUS procedures to load data into the map by selecting the Source Type and Source Name. Optionally, you may edit the name of the layer or the Visible and Refresh options for the source layer.

    For example, click the Add new button to create a layer. The default Source Type is External procedure. Click the Source Name ellipsis button to open the Get source file dialog box and double-click gmlayer.fex as the external procedure file. For more details about the procedure file, see How to Create Map Latitude/Longitude Coordinates in the Source File.

    When the source is selected, the Marker Groups box is populated with the values from the Field MARKERS in the WebFOCUS procedure.

    For more information about these properties, see Properties and Settings Dialog Box for Maps.

  5. Double-click a group from the Marker Groups box to set the associated Image, Tooltip, and Drill Downs.

    The following image is an example of the Marker Groups box populated with the marker groups created from the gmlayer.fex source file. For more information about creating marker groups in the source, see How to Create Map Marker Group Fields and Tooltip Fields in the Source File.

  6. You may edit the Image, Tooltip, or Drill Down for each marker group selected.

    Each marker group can have its own image and Tooltip.

    For example, select greenicon from the Marker Groups box. Double-click greenpin.png from the Image Source section. The marker image is automatically saved. Repeat this process to apply individual images to each of the marker groups.

    Tip: To select multiple marker groups at one time:

    • Press and hold the Shift key while selecting the marker groups from the Marker Groups box.
    • Edit the Tooltip and drill-down options to apply the selections to all of the marker groups selected.

    For example, apply the Tooltip to all of the marker groups by selecting Field as the Source Type and REVENUE_RANGE as the Source.

  7. Select the map object from HTML Composer canvas, and set the size and position in the Properties window:
    • Position: Left 30 px.
    • Position: Top 30 px.
    • Size: Height 260 px.
    • Size: Width 640 px.
  8. Save and run the report.

    You may use map controls to navigate around the map, zoom in or out, drag the map to a new position, select different map types, and see marker groups. For example, click the minus icon on the map to zoom out and see all of the colored marker groups.

    Note: The Zoom In and Zoom Out slider control appears on the map since the Size: Height property is greater than 280px. For details about setting properties, see Properties Window for Maps.

    For more information about using map controls, see the documentation from the website of each respective map.


WebFOCUS