In this section: |
The Business Intelligence Portal (BI Portal) is new in WebFOCUS 8. It is the successor to the Business Intelligence Dashboard (BI Dashboard). It does everything that BI Dashboard does, and more.
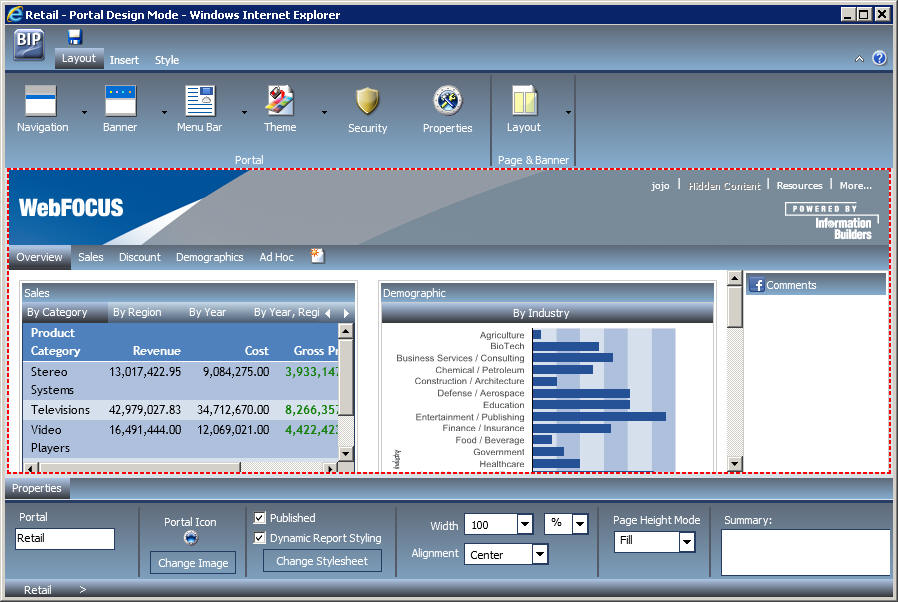
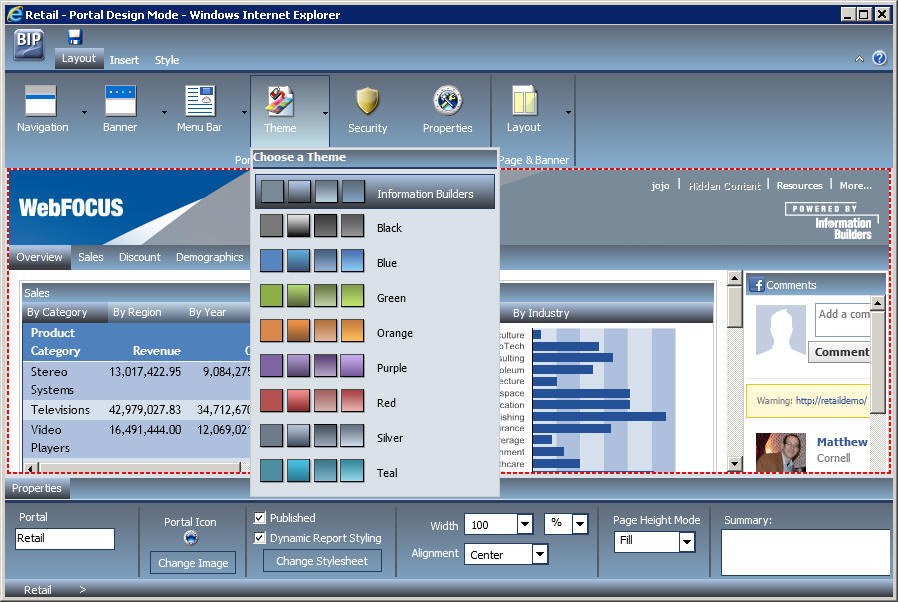
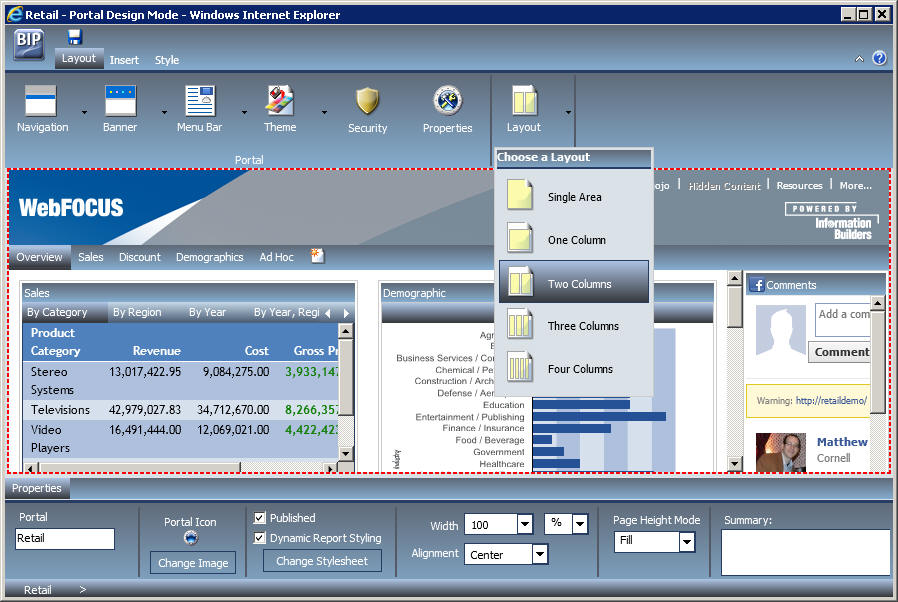
The BI Portal is about being able to build complete, modern websites. The end user experiences the drag-and-drop features that are available in popular online portals. This is a key point, as end users do not need to learn anything new. This results in no training and a high usage rate.
With the BI Portal, anyone who can build a report using InfoAssist can develop an impressive portal without any knowledge of web design. With this product, a portal is easy to build. The BI Portal uses the same familiar ribbon interface found in InfoAssist. Building a portal is just a matter of a few clicks and drag-and-drop actions.
Some of the highlights of the BI Portal include:
The following image shows a sample report in the BI Portal.
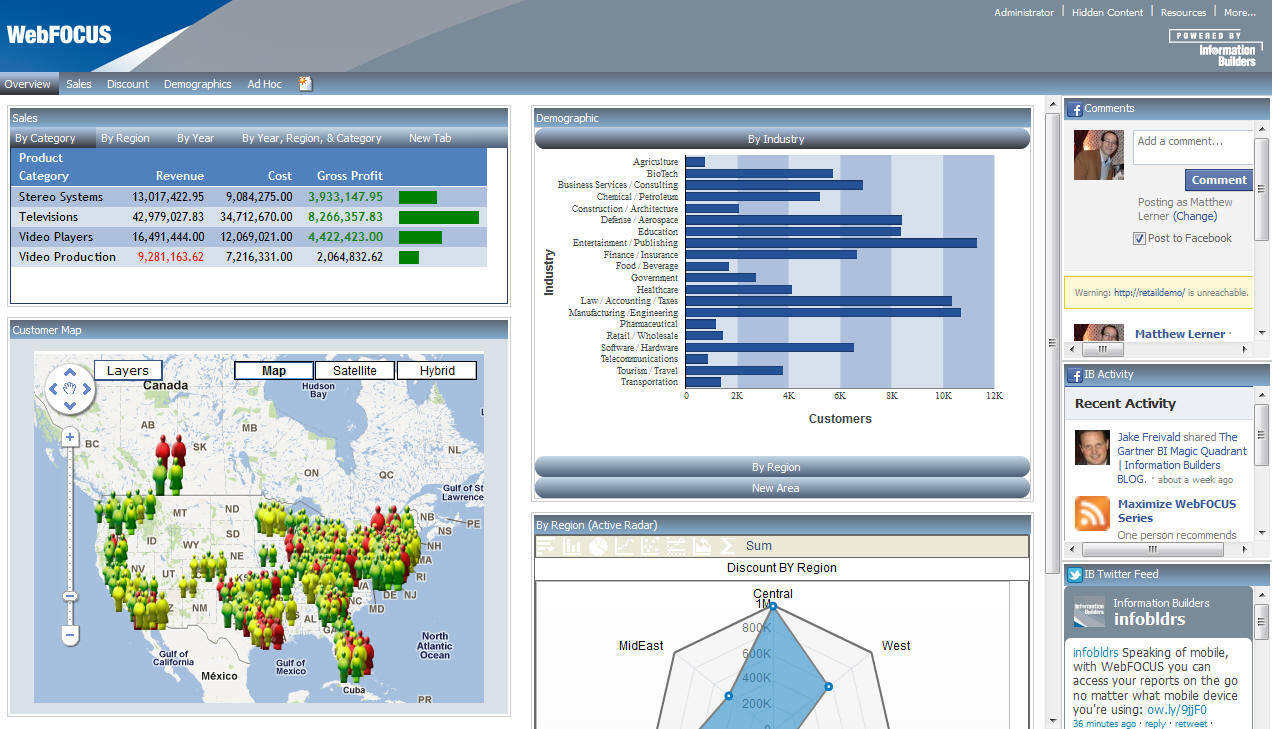
For more information on the BI Portal, see the Business Intelligence Portal manual.
As of Release 8.0 Version 05, you can create a custom sign in page for WebFOCUS 8. This allows you to override the default sign in page that is included with WebFOCUS 8, which is a basic sign in screen branded for Information Builders.
Using the following steps, you can create and customize a sign in page that is specific to your company or organization.
For more information on creating a custom sign in page, see the Technical Support site at https://techsupport.informationbuilders.com or the Business Intelligence Portal manual.
Through the WebFOCUS Business Intelligence Portal, you can now link to WebFOCUS Visual Discovery Analyst Edition (AE) Projects.
Visual Discovery AE Projects are web-based analytic dashboards composed of various interactive and interconnected charts that visually expose trends, relationships, and other measured values.
Visual Discovery AE is an integrated extension of WebFOCUS Enterprise Reporting that enables you to create advanced data visualization for executive-level dashboards. Data visualization turns raw data into perceptive images, providing a powerful and dynamic instrument for the discovery and reasoning of quantitative information.
You access a Visual Discovery Project through a link that you create in the Resource tree. Links to Visual Discovery AE Projects can be placed in the Portal, as drill-down links in WebFOCUS reports, or as independent links placed anywhere.
Note: The Visual Discovery AE option is only available with a Visual Discovery Analyst Edition license.
Within your own portal created through the WebFOCUS Business Intelligence Portal, you can filter reports that were created in any tool, or even by hand, using a form that was built in HTML Composer.
You can build an HTML Composer page in Developer Studio and from there create a form that is dynamically populated with the values for the fields that you want to filter in your reports. You then create the Refresh function, save the form, and then exit Developer Studio. Next, you sign into the BI Portal and launch the Portal Designer. Working in the Portal Designer, you can drag your form from the Resource tree and place it within your portal. When you are finished with your design work, exit the Portal Designer. Your portal is ready to launch.
For more information, see the Business Intelligence Portal manual.
| WebFOCUS |