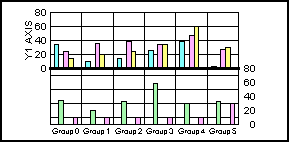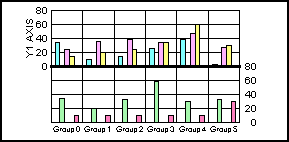
This property enables or disables the display of minor grid lines on the Y2-axis. The Y2-axis can include major and minor grid lines.
Syntax:
setY2MinorGridDisplay(boolean);boolean = getY2MinorGridDisplay();where:
Can be one of the following:
true draws minor grid lines on the Y2-axis. Use the Y2MinorGridStep property to control the number of grid lines that are drawn. Use Y2MinorGridStyle to control the appearance of minor grid lines.
false does not draw minor grid lines on the Y2-axis. This value is the default.
Example:
setDepthAngle(0);
setDepthRadius(0);
setLegendDisplay(false);
setGraphType(21);
setY2MajorGridDisplay(false);  setY2MinorGridDisplay(true);
setY2MajorGridDisplay(true); setY2MinorGridDisplay(false);
See Y2MajorGridDisplay, Y2MajorGridStyle, Y2MinorGridStep, Y2MinorGridStepAuto, Y2MinorGridStyle, getGridStyle(), setGridStyle().
| WebFOCUS |