You can add underlines to a financial report to set
off and clarify calculations and use a variety of formatting techniques
to draw attention to individual columns, rows, and cells in a financial
report. As in other WebFOCUS reports, certain formatting features
can be triggered by conditions that you define.
You can also drill down to another procedure or a URL from a
cell or column in a financial report.
xFormatting Columns, Rows, and Cells
You can apply a wide range of formatting options to
individual columns, rows, and cells in a financial report using
options on the Field Properties Style tab.
You can further refine formatting:
- For columns, by identifying the column
title and column data as separate objects for styling.
- For rows, by
identifying the row and title as separate objects for styling.
If you style a row and then a cell within that row, the cell
styling takes precedence for the cell.
If you style a column and then a cell with that column, the cell
styling takes precedence for the cell.
If you style a cell, then style a row or column that the cell
is in, the cell style will remain the same.
You can select an entire row by clicking the row label (R1, R2,
R3, and so on) and then style that row using the font toolbar. For
example, clicking R1 will highlight all entries in that row. While
the row is highlighted, changing the font color to orange will result
in every entry in that row having its font color changed to orange.
Row and cell styling options are specific to financial reports
created in the Financial Report Painter. Column styling options
are identical whether applied from the Financial Report Painter
or Report Painter.
x
Procedure: How to Format a Column in the Design Matrix
-
Right-click
a column and choose Options from the context
menu. The Field Properties dialog box opens at the Style tab.
-
Select Column
Title and Data as the active object, or select Column
Data or Column Title to style
them separately.
If you have already styled either the title or data for
a column and wish to quickly apply the same formatting to the other
element, click the appropriate button: Copy Title Style
to Data or Copy Data Style to Title.
-
Under
Column Layout, you can change column width and justification.
Width options are:
-
Maximum
-
Sets the width according to the length defined in the field format.
-
Minimum
-
Sets the width of the column according to the widest value
or heading in the field. This is selected by default.
-
Truncate
-
Enables you to specify where to truncate the column width
based on the specified units (inches or centimeters). To indicate
that a field value has been truncated in the browser, WebFOCUS places
an exclamation point (!) after every alphanumeric and text field
value and an asterisk (*) after every numeric field value.
-
Wrap
-
Enables you to specify where to wrap data based on the specified
units (inches or centimeters).
Justification options
are: left, right, center, or return to the default positioning.
-
Active Technologies Reports Present Hidden
-
Enables you to select the present hidden option. This determines
the columns that will be hidden from view in the report output,
when using the HTML active report output format.
-
Under
Graphical options, select the font characteristics, border or grid characteristics,
and/or background colors that you wish to apply to the column:
-
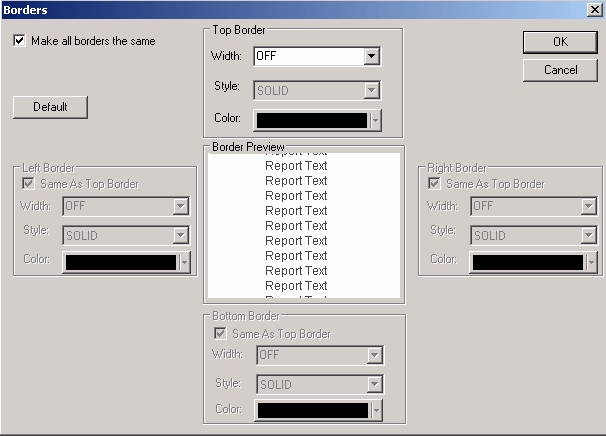
For borders, click the Select Borders button.
The Borders dialog box opens. Select width, style, and/or color
options from the drop-down lists.
You can apply the same specifications to all border lines
or vary specifications for top, bottom, right, and/or left borders.
Note: To
set borders in an HTML report, Cascading Style Sheets must be on.
Click Features from the Report menu. The Report
Options dialog box opens. Ensure that an HTML styled report format
is selected and verify that Cascading Style Sheets is checked.
When
Borders is selected, Grids is disabled.
-
For grids, click the Select Grids button.
Select a line style and indicate whether to display horizontal lines,
vertical lines, or both. This option applies to columns in PDF reports but
does not apply to columns in HTML reports.
When Grids is selected, Borders is disabled.
-
For fonts, click the Select Fonts button.
The Fonts dialog box opens. Select font name, font style, font size,
and/or color.
-
For background color, click the Single Color option
button under Background Coloring, and choose a color from the palette.
If you identify the active object as column data, the Alternating Background
Colors button is activated. You can use this feature to assign colors
to alternating rows in one or more columns.
Click OK to
return to the Style tab.
-
Under
Applying to condition in the Style tab, you can define or edit a condition
that controls when specified formatting options are applied to one
or more columns.
-
Click OK to
return to the matrix where many styling changes will be reflected.
-
Click the Run icon
on the toolbar to see the column formatting options applied in the
report output.
Tip: To affect other column
features, click the:
-
Drill Down tab to
drill down to another procedure, a URL, or another supported option.
-
General tab to
change the column title or field format, to make the column visible
or invisible in the output, or to activate other features.
For details about conditional formatting
and drill-down procedures, see the Creating Reporting Applications With Developer Studio manual.
Example: Formatting Columns With Data Visualization Graphs and Conditional Styling
This
example uses the joined data source files, CENTGL and CENTSYSF (see Sample Data for FML Hierarchy Examples), and takes as its starting point
the request created in Displaying One Summary Line for an FML Hierarchy. However, instead of applying
a predefined stylesheet, as you did in the earlier example, you will
be formatting the report yourself. You will apply bold formatting
to each column title, data visualization bar graphs to a numeric
column to help you quickly visualize trends and relationships in
your data, and conditional styling to the data in a second numeric column.
- If you completed
the referenced example, reopen the Design matrix. Click the Report
Option button on the toolbar, and in the Style tab,
click the Style File Selection button to
open the StyleSheet File Selector. Click the Add new
item button, select deflt.sty,
and click OK from the StyleSheet File Selection
dialog box. Click Finish and OK to
apply the selected StyleSheet.
If you did not complete the referenced
example, follow those instructions up to step 13, then return here.
- Click the Report
Option button on the toolbar and select the Output tab.
Make sure that HTML is the selected Display
format and that Cascading Style Sheets is
turned on. You will need this feature of HTML to display the data
visualization graphs. Click OK to return
to the matrix.
- Right-click
the Month Actual column and select Options from
the menu. The Field Properties dialog box opens at the Style tab.
- Make Column
Title the active object.
- Click the Select
Font button and choose Bold from
the Font Style box.
- Click OK.
The column title, Month Actual, becomes bold in the matrix.
- Repeat steps
3-6 for YTD Actual, then click the Field Properties General tab.
- Click the Visualize button.
The Data Visualization dialog box opens.
- Click the Visualize check
box and select RED from the Color drop-down
list.
- Click OK.
YTD Actual becomes bold in the matrix. You will not see the effect
of the data visualization graphics until you run the report.
- Click the Run icon
on the toolbar.
The output is:
Suppose
that you want to highlight Monthly Actual Values that are less than
100,000.
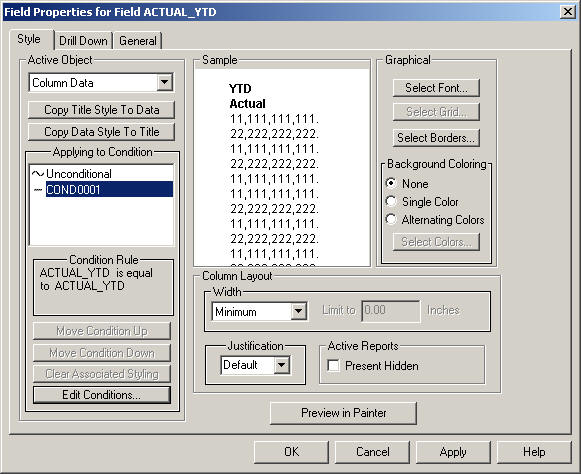
- In the Design
matrix, right-click the column title Month Actual and
choose Options from the menu. The Field Properties
dialog box opens at the Style tab. The active item is Column Data.
You will now define a condition to control the styling of this data.
- Click the Edit
Condition button. The Condition List dialog box opens.
- Click New.
The Edit Condition dialog box opens.
- Accept the
default condition name, COND0001. Select NAT_AMOUNT from
the Fields box, is less than from the Relation
drop-down list, and enter 100000 in the Values
box.
- Click OK.
The Condition List dialog box shows your entries.
- If they are
correct, click OK again to return to the
Field Properties dialog box at the Style tab, where you will define
the style you want to apply when the condition is met.
- Click the Font button.
The Font dialog box opens.
- Choose Bold from
the Font Style list and click OK. Notice
that your selection is reflected in the Sample box.
- Click the Run icon.
The
values below 100,000 appear in boldface type:
x
Procedure: How to Format a Row in the Design Grid
-
Right-click
a row label (either a default label like R1 or an explicit row label
that you have assigned) and select Options from
the context menu. The Field Properties dialog box opens at the Style
tab, with Row identified as the active object.
-
Under
Graphical, at the right of the Style tab, select the font characteristics,
border characteristics, and/or background colors that you wish to
apply to the row.
-
For borders, click the Select Borders button.
The Borders dialog box opens. Select width, style, and/or color
options from the drop-down menus.
You can apply the same specifications to all border lines
or vary specifications for top, bottom, right, and/or left borders.
Click OK.
Note: To set borders
in an HTML report, Cascading Style Sheets must be on. Click Features from
the Report menu. The Report Options dialog box opens. Ensure that
an HTML styled report format is selected and verify that Cascading
Style Sheets is checked.
-
For fonts, click the Select Fonts button.
The Fonts dialog box opens. Select font name, font style, font size,
and color. Click OK.
-
For background color, click the Single Color option
button under Background Coloring and choose a color from the palette.
Click OK.
-
Click OK to
return to the Design matrix where many styling changes will be reflected.
-
Click
the Run icon on the toolbar to see the row
formatting options applied to the report output.
x
Reference: Design Matrix Row Formatting Examples
The
following are examples of formatting rows using the design matrix.
Example: Emphasizing a Row Using Border Lines
The
following example places a thick dashed border around the RECAP
row identified by the label TOTCASH.
- Create the
report using the sample data source Ledger. In Report Painter, designate
Account as the For field and Amount as a Sum field.
- Click the Matrix tab.
- Above the matrix,
select the Use Multiple Values check box to
provide optimal flexibility in reusing tag values (although in this
illustration you will use each value only once).
- Drag the tag
values 1010, 1020, and 1030 onto
the matrix. Right-click each value and choose Row Properties.
The TAG dialog box opens. Click the General tab
and assign the labels CASH, DD,
and TD to rows R1, R2,
and R3, respectively. Click OK after
each entry.
- Create a RECAP
row that totals the values of rows CASH (R1), DD (R2), and TD (R3).
One
way to quickly create a row for this simple type of calculation
is to place your cursor in a column that contains numeric data and
highlight the values you want to add. Then click the Make
RECAP (Rows)
 icon
on the Design toolbar to create the RECAP row. A formula representing
the sum of the highlighted values (identified by their row labels)
appears in the new row, in the column that contained the values.
For information about creating more complex RECAP expressions, see Performing Inter-Row Calculations.
icon
on the Design toolbar to create the RECAP row. A formula representing
the sum of the highlighted values (identified by their row labels)
appears in the new row, in the column that contained the values.
For information about creating more complex RECAP expressions, see Performing Inter-Row Calculations.
- Select Styling from
the Report menu. The Report Options dialog box opens at the Style
tab. Click the Style File Selection button.
Click the Add new item button, select deflt.sty,
and click OK from the StyleSheet File Selection
dialog box. Click Finish, then click OK to
apply the selected StyleSheet. This will add some basic styling
to your report.
- Right-click
the row label TOTCASH and select Options from
the context menu.
- Click the Select
Borders button under Graphical options. The Borders
dialog box opens.
Note: To
set borders in an HTML report, Cascading Style Sheets must be on.
Click Features from the Report menu. The
Report Options dialog box opens. Ensure that an HTML styled report
format is selected and verify that Cascading Style Sheets is checked.
- To apply the
same specification to the top, bottom, right, and left borders,
leave the Make all borders the same check
box selected.
- In the Top
Border box:
- Select Medium from
the Style drop-down list.
- Select Dashed from
the Style drop-down list.
- Click OK to
return to the Style tab and OK again to return
to the Design matrix.
- Click the Run icon.
The
output is:
Notice
that the dashed border has been placed around the entire row. The
gray background is applied by a default style template that you
selected in step 6.
In the following variation, specifications
are applied separately to the top, bottom, left, and right border
lines. A heavy black border line is placed above and below the RECAP
row. A thinner dotted line is placed to the left and right of each
column in the row.
- Once again,
right-click the row label TOTCASH and select Options from
the context menu.
- Click the Select
Borders button under Graphical options. The Borders
dialog box opens.
- This time,
deselect the Make all borders the same check box.
In the Top Border box:
- Select Heavy from
the Width drop-down menu.
- Select Solid from
the Style drop-down menu.
- In the Bottom
border box, click the Same as Top Border check
box.
- In both the
Left and Right Border boxes, specify Width as Medium and
Style as Solid.
The output is:
x
Procedure: How to Apply Boldface to a Free Text Row
The following
procedure is an example of applying boldface to a free text row.
-
Create
the report using the sample data source Ledger. In Report Painter,
designate Account as the For field, and Amount as a Sum field.
-
Click
the Matrix tab.
-
In row
R1, right-click in the Row Type column. Choose Change
type to from the context menu, and select Text.
The TEXT dialog box opens.
-
Type ---CASH
ACCOUNTS-- in the input box, then right-click in the
Label column of row R1 and select Options. The
Field Properties dialog box opens at the Style tab.
-
Under
Graphical, click the Select Font button. The
Fonts dialog box opens. Select Bold in the
Font Style list and click OK. Click OK again
to return to the matrix.
-
Drag
the tag values 1010, 1020,
and 1030 onto the matrix.
-
Right-click
in the Row Type column for tag 1010 and select Row Properties.
When the TAG dialog box opens, click the General tab
and enter the title CASH ON HAND in the Title
input box.
-
Repeat
steps 6 and 7 for tags 1020 and 1030, using the titles DEMAND DEPOSITS
and TIME DEPOSITS, respectively.
-
In row
R5, right-click in the Row Type column, choose Change
type to from the context menu, and select Text again.
This time leave the input area in the Text dialog box blank to create
an empty text row. It will appear as a skipped line in the report output.
-
In row
R6, create a third text row and type ---OTHER CURRENT
ASSETS--- in the input area of the Text dialog box,
then right-click in the Label column of row R1 and select Options.
The Field Properties dialog box opens at the Style tab.
-
To apply
boldface to this text row, follow the instructions in step 5.
-
To complete
the report, drag the tag values 1100 and 1200 into
rows R7 and R8 on the matrix and enter the following row titles
for tags 1100 and 1200, ACCOUNTS RECEIVABLE and INVENTORY, respectively,
in the TAG dialog box.
The matrix should look as follows:
-
Click
the Run icon.
The output is:
Note: If
you were to look at the source code for this procedure, you would see
the two free text rows specified using the following code:
TYPE=REPORT,
     LABEL=R1          ,
     STYLE=BOLD, $
TYPE=REPORT,
     LABEL=R6          ,
     STYLE=BOLD,$
The
Financial Report Painter identifies a free text row with a row label designation.
x
Procedure: How to Format a Cell in the Design Matrix
The
following procedure describes how to format a cell in the Design
Matrix.
-
Right-click
a cell and choose Options from the context
menu. The Field Properties dialog box opens at the Style tab, with
Cell identified as the active object.
-
Under Graphical,
select the font characteristics, border characteristics, and/or
background colors that you wish to apply to the cell:
-
For borders, click the Select Borders button.
The Borders dialog box opens. Select width, style, and/or color
options from the drop-down menus. Click OK.
You can apply the same specifications to all border lines
or vary specifications for top, bottom, right, and/or left borders.
Note: To
set borders in an HTML report, Cascading Style Sheets must be on.
Click Features from the Report menu. The Report
Options dialog box opens. Ensure that an HTML styled report format
is selected and verify that Cascading Style Sheets is checked.
-
For fonts, click the Select Fonts button under
Graphical options. The Fonts dialog box opens. Select font name,
font style, font size, and color. Click OK.
-
For background color, click the Single Color option
button under Background Coloring, and choose a color from the palette.
Click OK.
-
Under Applying
to condition, you can define or edit a condition that
controls when specified formatting options are applied to a cell.
-
Click OK to
return to the Design matrix, where most formatting changes will
be reflected.
-
Click
the Run icon on the toolbar to see the cell formatting
options applied in the report output.
Note: To
drill down from the selected cell to another procedure or to a URL,
click the Drill Down tab. For details, see Formatting Columns, Rows, and Cells.
Although certain options on the General
tab are enabled when cell is the active object, these options will
be applied to the entire column, not only to the selected cell.
The Field Properties General tab options are available for the following
fields in the Design Matrix.
- Set Title and
Output options are available for the FOR field in the Design Matrix.
- All options
(except Table of Contents) are available for SUM and DETAIL fields
in the Design Matrix.
Example: Highlighting a Cell With Border Lines and Boldface Type
The
following example places a solid line of medium thickness around
a cell in the RECAP row identified by the label TOTCASH.
- Create the report
using the sample data source Ledger. In the Report Painter, designate Account as
the For field and Amount as a Sum field.
- Click the Matrix tab.
- Above the matrix,
click the For Multiple button to provide optimal
flexibility in using tag values (although in this illustration you
will use each value only once).
- Drag the tag
values 1010, 1020, and 1030 onto
the matrix. Notice that the tag values appear in the Title column.
To provide more meaningful titles, either type the following entries
into the cells on the matrix or open the TAG dialog box and enter
the new titles in the General tab. Replace 1010 with CASH on HAND,
1020 with DEMAND DEPOSIT, and 1030 with TIME DEPOSIT.
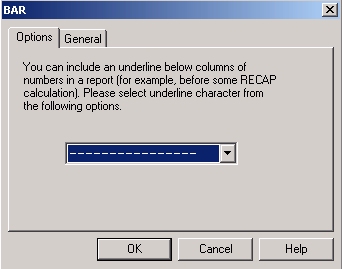
- In row R4, right-click
on the Row Type column, choose Change
Type to, and then Bar. The BAR
dialog box opens. Click OK to confirm the
default underline character. The underline is displayed in the Amounts
column, below the values to be summed.
- In row R5, create a RECAP row that totals
the values of rows R1, R2, and R3. Click OK.
One
way to quickly create a row for this simple type of calculation
is to place your cursor in a column that contains numeric data and
highlight the values you want to add. Then click the Recap icon
on the Design toolbar to create the RECAP row. A formula representing
the sum of the highlighted values (identified by their row labels)
is displayed in the new row, in the column that contained the values.
For information about creating more complex RECAP expressions, see Performing Inter-Row Calculations.
- Change the Title
for the RECAP row to TOTAL CASH.
The matrix appears as follows:
- Right-click
the cell that contains the RECAP formula and select Options from
the menu. The Field Properties dialog box opens at the Style tab,
with Cell identified as the active object.
- Click the Select
Borders button under Graphical options.
The Borders
dialog box opens.
Note: To
set borders in an HTML report, Cascading Style Sheets must be on.
Click Features from the Report menu. The
Report Options dialog box opens. Ensure that an HTML styled report
format is selected and verify that Cascading Style Sheets is checked.
- To apply the
same specification to the top, bottom, right, and left borders,
leave the Make all borders the same check
box selected.
- In the Top Border
box:
- Select Medium from
the Width drop-down list.
- Select Solid from
the Style drop-down list.
- Click OK to
return to the Style tab and OK again to return
to the Design matrix.
- Right-click
the same cell and choose Options again. Click the Select
Font button and choose Bold from
the Font Style list.
- Click OK to
return to the Style tab and OK again to return
to the Design matrix.
- Click the Run icon.
The
output is:
The
bold font style and solid border draw attention to the Total in
the Amount column.
x
Procedure: How to Apply Conditional Formatting to a Cell
To
create a condition:
-
Right-click
the cell in the Design matrix and select Options from
the context menu.
The Field Properties dialog box opens at the Style tab.
-
Click
the Edit Conditions button.
The Condition List dialog box opens.
-
Click New.
The Edit Condition dialog box opens.
-
Type
a name for the condition or accept the default.
-
Select
the field for which you want to define a condition from the Field box.
-
Select
a relation from the Relations list.
-
Specify
a value by doing one of the following:
- Type a literal value in the Value box.
- Click the Values button to display existing
database values and select a value.
- Click Another Field to display other
fields in the report and select a field.
-
Click OK.
The condition is added to the Condition List in the Condition
List dialog box, from which it can be applied to one or more cells,
as well as to columns or rows.
Tip: To create another
condition, repeat steps 4 to 10.
-
Click OK again
to return to the Style tab on the Field Properties dialog box.
The default condition name (for example, COND0001) appears
in the Applying to Condition field box.
The condition you
created appears in the Condition Rule box.
-
You
are now ready to associate the condition with a style. Select a defined
condition from the Applying to Condition dialog box in the Style
tab.
-
In the
Graphical area of the Style tab, choose one or combination of the following:
xDrilling Down From a Column, Cell, or Row
The drill down feature enables you to add one or more
layers of detail to a report by embedding procedures into the report.
A drill down procedure can be:
- Any type of
executable object, such as a report or graph.
- A link to a
URL from an HTML or PDF report, or to a JavaScript from an HTML report.
- A link to a
Maintain case (function).
- A link to a
Maintain procedure.
After the base (summary) report appears
in the browser, you can drill down to selected data a URL, or script
(or procedure). For example, if you run a report on the country
and models of all cars imported into the United States, and you
have embedded the appropriate procedures in the report and defined
the correct parameters, you can drill down on:
-
ENGLAND, to
view a more detailed report on the sales of all English cars.
-
JAGUAR, to
see specific sales information on the Jaguar.
- A summary report
row, to view the values behind each field in the row.
From either Report Painter or the Financial Report Painter, you
can drill down from a column title and its data, or from the title
only, or the data only.
In addition, from the Financial Report Painter you can drill
down from a single cell in the matrix or from a row or row title.
These behaviors are invoked from the Field Properties Drill Down
tab. The active object box indicates the matrix element from which
the drill down will be implemented. The Drill-Down Definition indicates
what you want to drill down on: a URL, a procedure, or one of the other
supported options.
Notice that you can also define conditions that determine when
to run an embedded drill-down procedure. For example, suppose you
have embedded a procedure in the country column of the summary report,
but you want your drill-down report to appear only for England. You
can define a condition that enables the embedded drill down only
when country equals England.
The mechanics of establishing a drill-down relationship are the
same, regardless of the active object you choose.
For details about this process, see the Creating Reporting Applications With Developer Studio manual.
x
Procedure: How to Access the Drill Down Tab
-
For a column, right-click the column title.
If you
select Options from a column title, Column and Title is the active
object. However, you can change the active object to column title
or column data.
-
For a cell, right-click the cell, then choose Options from
the context menu. The Field Properties dialog box opens. Click the Drill-Down tab.
If
you select Options from a cell, Cell is the active object. However,
you can change the active object to column and title, column title,
column data, row title, or row data.