Procedure: How to Run a Log Report
The Log report displays the messages generated by the flows that have been run from the DMC.
-
In the
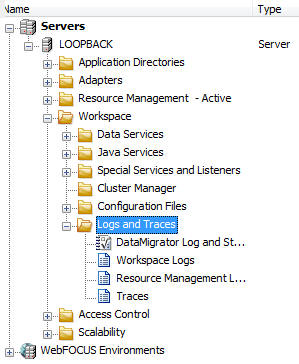
navigation pane, expand the Workspace folder,
followed by the Logs and Traces folder, as
shown in the following image.
-
Double-click DataMigrator
Log and Statistics or right-click it and select View.
The Log and Statistics window opens, as shown in the following image.
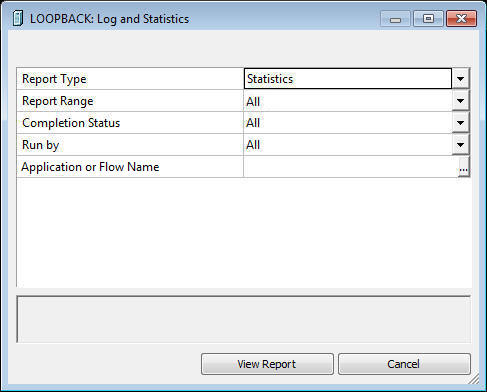
- Select Log from the Report Type drop-down menu.
- From the Report Range drop-down menu, select Last, All, or Specify Time.
- Optionally, specify a Flow Name.
- Click View Report.
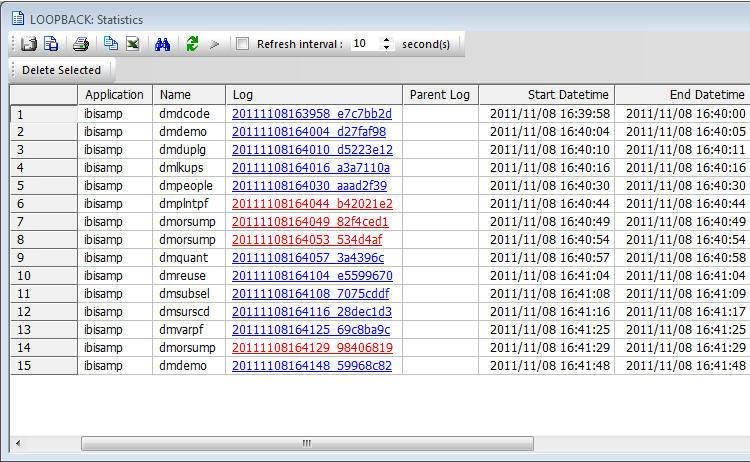
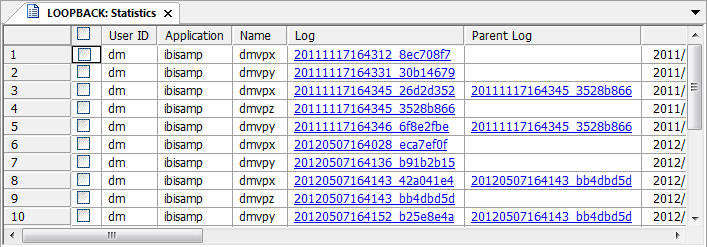
The report opens in the workspace, as shown in the following image.
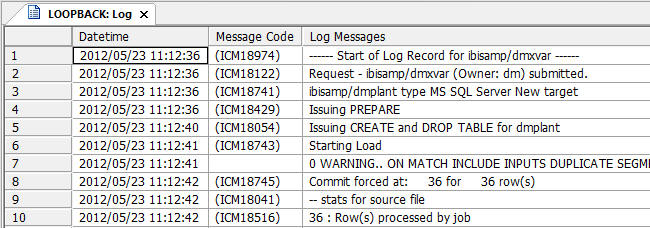
Note: For process flows, you can drill down to details of the flow components by double-clicking the blue Job ID line.