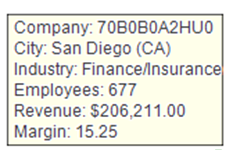
Using Chart Tools

In this section:

This section describes the different available chart tools and their functions.


Top of page

x
Displaying Brushups

To display brushups, hover the cursor over the category from which you want to obtain additional information. By default, the brushups will show the total amount represented in the chart and then the selected amount. Other brushups can be configured by the project designer to show other statistics. For example:


Top of page

x
Zooming and Scrolling

The bars located on the right side or bottom of the chart (depending on chart orientation) allow you to zoom in and out of the chart.

To zoom in or out. Hover the cursor on the end of the bar, where two bars are located. The shape of the cursor will change, indicating that it is possible to resize the bar. Click and hold the button, and then drag the mouse to achieve the desired zoom level.

It is also possible to use the bar to scroll the chart. Click in the middle of the bar and move it up and down, or left and right to scroll.


x
Chart Toolbar

There are many functions available on the chart level, which are located on the chart toolbar, as shown in the following image.

To open the chart toolbar, hover the cursor over the blue arrow, and the toolbar will be displayed.


Top of page

x
Using a Hierarchy

A hierarchy means that there is a level of information above or below what is currently shown in the chart. The following table lists and describes the hierarchy buttons that are available from the chart toolbar.

Hierarchy Button

Description

Drill down. Views the information in a level below what is currently shown.

Drill up. Views the information in a level above what is currently shown.


x
Changing the Sort Order

You can change the parameter on which the values or categories in a chart are ordered. The order of the values or categories can help expose visual patterns and can be useful in the data visualization process.

Sort by. Select criteria from the drop-down list by which to sort the data currently displayed in the chart.


x
Searching in a Data Sheet

You can also search for a specific value or name in a data sheet.

Find Items. Use this option to look for a specific value in the data. You are prompted to select the field in which you are going to perform the search, the value that you are looking for, and whether you would like the matches to be case-sensitive.


WebFOCUS