Using the Maps Functionality
This section describes how to use maps with the custom
functionality provided by Information Builders. You can select multiple
markers on maps at run time and drill down to WebFOCUS procedures
filtered by the marker locations selected.
Note: For Google and Bing maps, the functions in this
section can be accessed by right-clicking on a map during run time.
To access the same functions for ESRI JavaScript API maps you must
click on the Tools button at the top of the map during run time.
There are several ways of selecting markers,
such as:
- Manual Selection.
- Shape Selection.
- Combination
Selection.
Note: Selected markers are indicated by the Selected Marker
Image that you supply on the map Properties window. For more information
about the map Properties window, see Properties Window for Maps.
x
Procedure: How to Use Manual Selection in the Map
Manual
selection is the act of clicking on one or more individual markers
in succession.
-
To initiate a manual selection, click on a marker while pressing and
holding the Ctrl key from your keyboard.
-
To clear a selected marker, press and hold the Ctrl key and
click the marker again.
-
To make selections without the risk of clearing a marker, press
and hold the Shift key rather than the Ctrl Key.
Note: The Shift key does not clear the selected markers.
For example, the image below shows
a map with three markers, as indicated by a red, green, and blue
marker.
When
the green and blue markers are selected, they become purple markers,
as shown in the following image.
x
Procedure: How to Use Shape Selection in the Maps
Shape
selection is the act of clicking in a specific location on the map
and then drawing an area with the mouse on the map to form a shape.
This shape enables you to select all markers within the drawn area.
The map provides various selector shapes to choose from.
Tip: The shape selection
options are available from the right-click context menu on Google
and Bing maps and through the Tools menu for ESRI JavaScript API
maps. You may also customize these options from the map Properties
window.
-
To initiate a shape selection, right-click anywhere on the
map or click the Tools button if you are
using an ESRI JavaScript API map.
The Tools menu appears, as shown
in the image below.
You may create a new polygon shape, change the polygon
settings, show or hide markers from a layer, and refresh a layer.
-
To create a shape selection, select an option from the New
Polygon menu, left-click and drag your mouse from the shape selection
point on the map.
Note: The method by which selections are made depends
on the selector shape used. For details, see How to Create Polygons in the Map Output.
The shape selector is created with the selected markers,
and a Tooltip indicating the details of the shape selector, as shown
in the example image below.
-
To clear the markers in the shape selection, unselect Select
Markers from the Update Polygon menu.
Note: Selecting Clear
Selection clears all of the selected markers from the
map.
-
To remove the shape selection from the map, select Remove from
the Update Polygon menu.
Note: Selecting Remove
Polygons removes all the shape selectors from the map.
-
Optionally, to reposition any of the selector shapes to a different location
on the map:
- Pause the
mouse over the center of the selector shape to be repositioned.
- Left-click
and drag from the middle of the shape to the new location.
The selector shape is repositioned over
the new location.
x
Procedure: How to Use Combination Selection in Maps
Combination
selection is the act of using both the manual selection method and
the shape selection method separately, or in coordination with one another,
to make marker selections. Multiple selections can be made by using
any of the above procedures prior to drilling down to WebFOCUS procedures.
x
Procedure: How to Show and Hide Markers in Maps
All
layer marker groups are visible in a map by default. You may edit
the visibility option to hide the markers in a map at run time.
-
To edit the visibility option from the map output:
The selected markers are not visible on the map,
as shown in the image below.
Tip: To show all
marker groups from all layers on the map, select Show
All from the Layers menu.
-
To edit the visibility option from the Properties and settings
dialog box:
- From the HTML
Composer with a map created, go to the Properties and settings dialog
box.
- Click the Visible option
so that it does not have a check mark in the box next to it.
Note: Only
layers have a visibility option on the Properties and settings dialog
box. You may hide individual markers from a layer in the map output,
as described in the first step of this procedure.
When you run the map, all of the layer markers are
not visible.
x
Procedure: How to Refresh the Map Output
You
may refresh the map output on demand or by setting up an automatic
refresh at a timed interval.
-
To refresh a map on demand:
- From the map
output, right-click anywhere on the map or click the Tools button
if you are using an ESRI JavaScript API map.
The menu appears.
- To refresh
all layers on the map, select Refresh All from
the Layers menu.
- To refresh
individual layers on a map, select Refresh Layer from
the layer name of the Layer menu.
Note: The
layer name is the unique name for the layer created in the Map Properties
dialog box. For more information about the layer options, see Properties and Settings Dialog Box for Maps.
-
To automatically refresh the map output at a timed interval:
Refresh is not applicable
to markers in the Marker Groups.
The source for the layer refreshes on the map at
the set timed interval.
x
Procedure: How to Create Polygons in the Map Output
The
available shape selections from the New Polygon menu are Freehand,
N-sided Polygon, Rectangle, Bullseye Fixed, and Bullseye Freehand.
For details about bullseye charts, see How to Create Bullseye Charts in the Map Output.
Note: Polygons
created when using ESRI maps are unable to be moved, copied, or
resized.
-
Create a freehand polygon.
A freehand polygon shows the selector shape as a series
of lines that you mark at specific points on the map.
- For Google
and Bing maps, right-click anywhere on the map and select Freehand from
the New Polygon menu. For ESRI JavaScript API maps, click the Tools button
and select Freehand from the New Polygon
menu.
A cross is indicated on the map.
- Left-click
to indicate the starting point and create the crosshair on the map.
- Drag and release
to drag a line from one point to the next. Repeat left-click, drag,
and release. These clicks will represent the corners of the shape
to be drawn.
- When you close
the connector lines, the selected markers are indicated within the
polygon shape, as shown in the image below.
Note: You can
also use the Freehand Close option to close the polygon. The Freehand
Close option is found in the New Polygon menu. This option is unavailable unless
you are using the Freehand option. The Freehand Close options is
best used on an iPad device.
-
Create an N-sided polygon.
An n-sided polygon shows the selector shape as a continuous
line you draw around the markers to be selected. N-sided indicates
that you can select the number of sides for the polygon.
Note: The
default polygon is a circle.
To change the number of sides for the polygon:
- Select Number
of Sides from the Polygon Settings menu.
Note: The
default polygon is a 12-sided polygon. You may change the number
of sides for a polygon by using the Polygon Settings menu on the
map.
- Select the
number of sides you wish to create. Options are 6 sided, 8 sided,
12 sided, 16 sided, or Circle (this is the default), as shown in
the image below.
Optionally,
you may select to Show Tooltips for the polygons on the map.
- Select N-sided
Polygon from the New Polygon menu and click and drag
the object on the map.
The polygon shape has the number of sides
that you indicated from the Polygon Settings.
-
Create a rectangle.
x
Procedure: How to Create Bullseye Charts in the Map Output
You
may create a fixed or freehand bullseye chart in the map output.
A bullseye chart is used to show radius distance from a location
using three rings of increasing size. The bullseye options are available
from the New Polygon context menu on the map.
Note: You may customize
the ring and radius options of the bullseye chart from the Map Properties
dialog box. For more details, see Properties Window for Maps.
-
Create a fixed bullseye chart.
A fixed bullseye chart applies a predetermined size at
the selected location.
-
Create a freehand bullseye chart.
A freehand bullseye chart enables you to create the size
and location of the initial bullseye chart.
-
Resize the bullseye chart.
Optionally, you may select Freehand
resize to manually resize the bullseye chart.
x
Reference: Clearing and Removing Shape Selectors on Maps
x
Reference: Running Maps Against a Secured Server
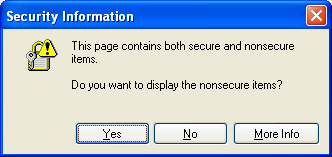
Whenever
maps are run against a secured server (SSL configuration), the user
is prompted with a message for display of secured and unsecured content
on the HTML page. This message originates from map provider and
is shown because they establish a link to an unsecured server to
present the map.
For Internet Explorer® 7, the message appears
as follows.
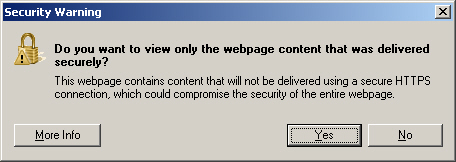
For
Internet Explorer 8, the message appears as follows.
x
Reference: Enabling Actions for Shape Selectors on Maps
When
actions are enabled from the map Properties window, you may Copy,
Delete, Move, and Resize the polygon shape selectors on the map.
All action options
are selected by default. For more information about enabling these options,
see Properties Window for Maps.
- To copy a
shape selector, left-click in the center of the polygon, press the
Shift key, drag the polygon and release it to create a copy of the
polygon.
- To delete
the shape selector, left-click in the center of the polygon, and
press the Delete key.
- To move the
shape selector, left-click and hold in the center of the polygon
and drag the polygon to move it.
- To resize
the shape selector, drag the edge of the polygon shape to resize
the polygon.