Using the Grid Tool

How to:

Reference:

The Grid Tool enables you to change the column order, select multiple columns to sort ascending or descending, hide and show columns, add a calculation result to a column, and add subtotals in the active report.

This topic describes how to show the Grid Tool menu option when an active report is run, and how to use the Grid Tool.


Top of page

x
Procedure: How to Show the Grid Tool Menu Option for an Active Technologies Report
  1. Create a report in Report Painter.
  2. From the Report menu, select Output.

    The Report Options dialog box opens.

  3. From the Output Format drop-down list, select HTML active report (AHTML).
  4. On the Report Options dialog box, click the Format tab.

    The Format tab of the Report Options dialog box provides options for formatting an active report.

  5. In the Menu options section, to the right of the User type drop-down list, click the ellipsis button. 
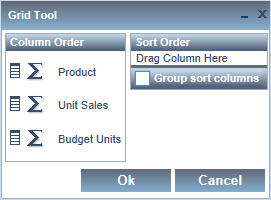
The Customize User Interactivity dialog box opens, enabling you to customize the options for each user type.

    The following image shows the options on the Customize User Interactivity dialog box for a Power user. The Grid Tool check box is located at the lower-right of the dialog box. For a Power user, the Grid Tool is selected by default. For an Analytical or Business user, the Grid Tool is deselected by default.

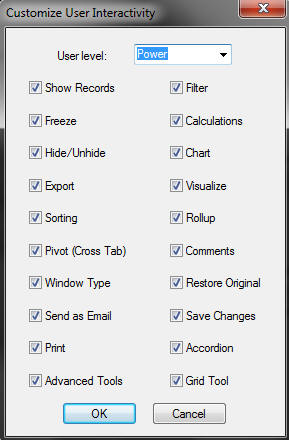
    Tip: The Advanced Tools include the Grid Tool, the Pivot Tool, and the Chart/Rollup Tool. The Advanced Tools check box at the lower-left of the Customize User Interactivity dialog box controls the display of the menu options for all three tools when an active report is run.

  6. Locate the Grid Tool check box, and do one of the following.
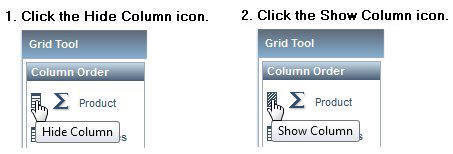
    • Select the Grid Tool check box to show the Grid Tool menu option for the active report at run time. Click OK.
    • Deselect the Grid Tool check box to hide the Grid Tool menu option at run time, and click OK.
  7. Click OK on the Report Options dialog box to close it.
  8. Run the active report. 
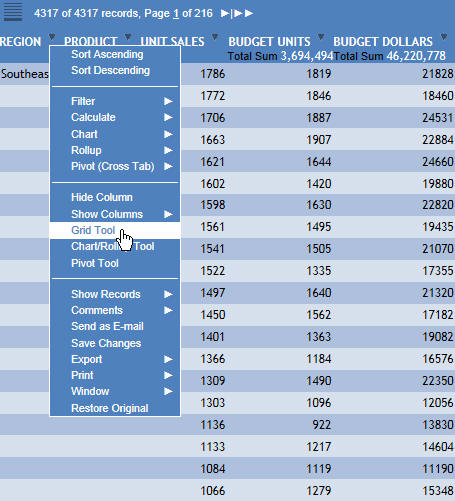
Click the arrow in any column heading of the active report to display a menu of options.
    • If you selected the check box for the Grid Tool on the Customize User Interactivity dialog box, you see the Grid Tool option on the menu, as shown in the following image.

    • If you deselected the check box for the Grid Tool on the Customize User Interactivity dialog box, you do not see the Grid Tool option on the menu when you click the arrow in a column heading.
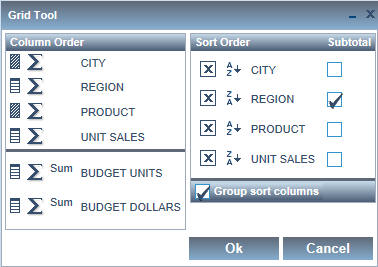
Top of page

x
Procedure: How to Use the Grid Tool
  1. Run the active report, click the arrow in any column heading, and select Grid Tool.

    The Grid Tool opens, as shown in the following image.

    The columns are displayed in the order that they appear in the active report.

    Tip: You can drag the columns in the Column Order section to reorder the list.

  2. To hide or show columns, click the Hide Column icon next to the column name.

    By default, the Grid Tool displays Hide icons for the hidden fields (HIDE=ON StyleSheet setting) and NOPRINT fields in the procedure. The Grid Tool displays Show icons for anything else.

  3. To add a calculated result to the column, click the calculation icon next to the column name. You can assign a different calculation result for each field.

    There are no calculations set by default.

    • Sum, Avg, Min, Max, Count, or Distinct are available for numeric fields.
    • Min, Max, Count, or Distinct are available for Date type fields.
    • Count or Distinct are available for non-numeric alpha string fields.
    • None indicates that there will be no aggregation performed or applied for the column in the report. When None is selected, Detail appears next to the calculation icon, implying that the report will display detailed data for this column in the report.
  4. Drag the columns from the Column Order into the Sort Order section. You can also double-click to add columns.

    When columns are added to the Sort Order section, options for sorting ascending or descending appear. The default sort order is ascending, lowest to highest (A to Z). Click the sort order icon to switch to descending, highest to lowest (Z to A).

    In the example below, Product is descending and Unit Sales is ascending.

  5. You can edit the sort fields by clicking the X icon to delete columns, drag multiple columns into the Sort Order section, reorder the sort fields, and group sort columns.
  6. Click Group sort columns to group the report by columns in the Sort Order section.

    A Subtotal column appears in the Sort Order section. No subtotals are selected by default.

    When Group sort columns is selected, the columns in the report are grouped by the order specified in the Sort Order section. These columns are repositioned to the beginning of the report and override the Column Order list.

  7. To add a subtotal for an aggregated column.
    • Select the Subtotal check box next to the column name.
    • Click Group sort columns again to hide the Subtotal column.

    In the following example, CITY and PRODUCT are hidden, BUDGET UNITS and BUDGET DOLLARS have a Sum aggregation type, CITY, REGION, PRODUCT, and UNIT SALES appear in the Sort Order column, Group sort columns is selected, and Subtotal is applied to REGION.

  8. Click OK to close the Grid Tool.

    The active report is generated based on the sort fields selected.

    In the following example, the subtotal of sum values appear under BUDGET UNITS and BUDGET DOLLARS by the REGION field. You can select Grid Tool from the column menu to open the Grid Tool again.


Top of page

x
Reference: Grid Tool Usage Notes

The following apply when you use the Grid Tool in active reports:


WebFOCUS