The following topics describe some of the objective-related
views that are available in PMF.
xObjectives - Previous vs. Current
The Objectives - Previous vs. Current view displays
current and previous period achievement and comparative weights
for the primary objectives across all perspectives for the selected
scorecard. This view displays a dimension tree to the left of the
report that enables you to drill into the underlying metrics of
any particular area of the scorecard. You can analyze the previous
and current period performance of the objectives for any aspect
of any dimension.
To run the Objectives - Previous vs. Current view, select Analysis, Objective,
or Perspective in the Type drop-down menu
of the Analytics tab, then select Objectives - Previous
vs. Current from the View drop-down menu.
The following image is an example of the Objectives - Previous
vs. Current view, which displays the heading Perspective - Objectives
Summary Grid.
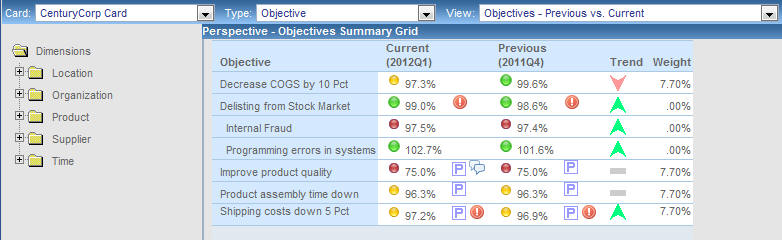
When using the tree to drill into a specific area of the scorecard,
the view is refreshed and a summary of the type of objectives you
are viewing appears at the bottom of the report.
For example, if you expand the Organization
folder, drill into the Sales subfolder, and select US,
the following summary information appears below the report data:
Scorecard: CenturyCorp Card
Division: Sales
Country: US
Time Range: Previous vs. Current
xShow Objectives (Curr vs. Prev)
When you click a Perspective drill-down hyperlink, for
example, in the Strategy view of the Executive Booklet, and select Show
Objectives (Curr vs. Prev), the drill down takes you
to the Objectives view, as shown in the following image.
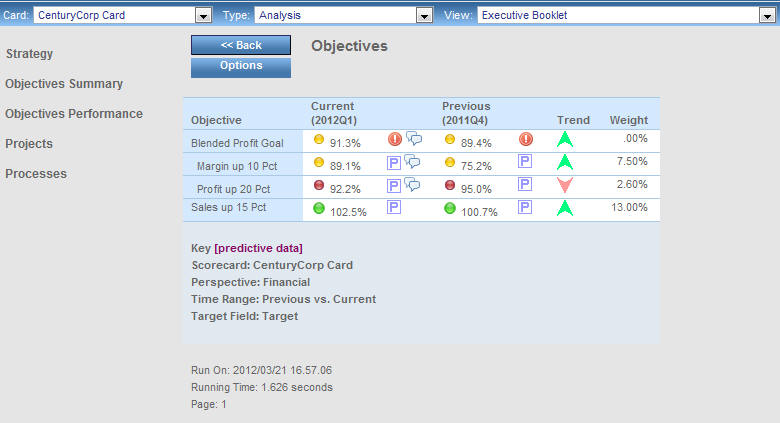
In this view, current metrics for an objective are compared to
previous metrics for the selected objective, and the trend, scorecard
weight, and perspective weight are displayed.
To display related data for an objective, click an Objective
hyperlink and select the desired option. For a list of available
drill-down options, see Objective Drill-Down Options.
x
When you click a drill-down hyperlink, for example,
in the Stop Light view, and select Causes & Effects,
the drill down takes you to the Causes & Effects view, which
contains data showing strategy relationships. If you have a strategy set
up in PMF, you can drill down to research strategic relationships
for any metric.
Cause and effect relationships cascade automatically as you navigate
drill-down hyperlinks for metrics in the Caused By and Affects columns
to move up and down the strategic chain of events. The following
is an example of the Causes & Effects view.
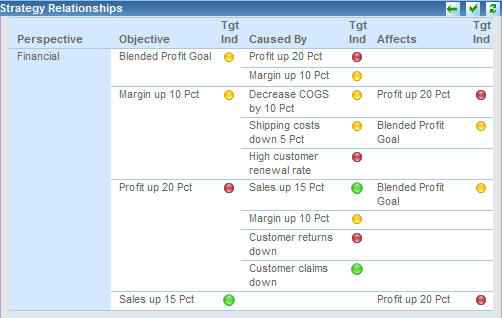
The Causes & Effects view displays hyperlinked metrics in
the Perspective, Objective, Caused By, and Affects columns.
To display related data for the perspective, click the Perspective
hyperlink and select the desired option. For a list of the available
drill-down options, see Perspective Drill-Down Options.
To probe deeper into the metrics listed in the Objective, Caused
By, and Affects columns, click a hyperlink and select the desired
option. For a list of the available drill-down options, see Objective Drill-Down Options.