You can include API calls in WebFOCUS procedures to
create dynamic, sophisticated graphs that showcase your business
data.
If you save a graph generated by a WebFOCUS procedure in Scalable
Vector Graphics (SVG) or Portable Network Graphics (PNG) format,
you can produce a high quality image for display or print, with
advanced features provided by the API calls.
xSuppressing Data Text for Small Risers
The setAutoHideDataTextOnSmallRisers property, when
enabled, suppresses the display of data text if the height of the
riser is smaller than the height of the data text.
Syntax:
void setAutoHideDataTextOnSmallRisers(boolean);
boolean = getAutoHideDataTextOnSmallRisers();
where:
- boolean
Can be one of the following:
- true
Suppresses the display of data text that is larger than its riser.
- false
Displays all data text regardless of the height of the riser.
This value is the default.
Example:
setAutoHideDataTextOnSmallRisers(true);
With setAutoHideDataTextOnSmallRisers(true),
the risers that are too small for data text do not have any text
in them.
setAutoHideDataTextOnSmallRisers(false);
With setAutoHideDataTextOnSmallRisers(false), the risers that
are too small for data text still have the text in them. The text
in the small risers overwrites text from other risers.
xMaking Y-Axis Labels Inherit the Region Color
The setAltFmtMatchAxisLabelColor property controls whether
Y-axis Labels associated with the alternate frame region inherit
the color specified for that region. When enabled, the labels are
colored with the color specified for the region. When disabled,
labels are displayed using the default color.
Syntax:
void setAltFmtMatchAxisLabelColor(boolean);
boolean = getAltFmtMatchAxisLabelColor();
where:
- boolean
Can be one of the following:
- true
Causes Y-axis labels to inherit the color of alternate frame
regions.
- false
Causes Y-axis labels to use the default color. This value
is the default.
Example:
The following request sets the setAltFmtMatchAxisLabelColor
property to true:
setDisplay(getY1AltFmtFrame(),true);
setAltFmtFrameNumColors(getY1AltFmtFrame(),2);
setAltFmtFrameSeparator(getY1AltFmtFrame(0),80.0);
setFillColor(getY1AltFmtLabel(0),new Color(0,0,0));
setFillColor(getY1AltFmtFrame(1),new Color(255,0,0));
setReferenceLineValueY1(0,80.0);
setLineWidth(getReferenceLineY1(0),2);
setFillColor(getY1AltFmtFrame(0),new Color(232,232,232));
setAltFmtMatchAxisLabelColor(true);
With setAltFmtMatchAxisLabelColor(true),
the Y-axis labels inherit the color red when the alternate frame
region is red and inherit the color grey when the alternate frame
region is grey.
Changing setAltFmtMatchAxisLabelColor()
to false, causes the Y-axis labels to use the default color, not
the colors of the alternate frame regions.
setAltFmtMatchAxisLabelColor(false);
xAutomatic Color Rendering and Styling of Graph Risers
There are two methods you can use to automatically render
the color and style of graph risers:
-
Repeated Shading. You can automatically shade successive
groups of risers by lightening or darkening the colors used for
the risers in the previous group. This type of shading is implemented
using color mode 4, a looping index, and a factor for lightening
or darkening the colors.
-
Gradient Coloring. You can automatically create a gradient
effect between the colors for the first and last risers by defining
a starting color and ending color for the risers. This type of coloring
is implemented using color mode 5, a starting color, and an ending
color.
x
Syntax: How to Implement Automatic Repeated Riser Shading
You
can automatically shade groups of risers by lightening or darkening
the color values in each successive group. You implement this type
of shading by setting the color mode to 4, setting a looping index
equal to the number of risers in each group, and setting an automatic
color lightening or darkening factor:
setColorMode(4);
setSeriesLooping(s);
setAutoColorLerpFactor(f);
where:
- setColorMode(4);
Implements automatic repeated riser shading.
- s
Identifies the number of risers in each group on the graph.
- f
Is a double-precision number between -1 and 1 that represents
the factor for lightening or darkening each successive group of
risers. A positive factor specifies that each successive group of
risers will be lighter than the previous group. A negative number
specifies that each successive group of risers will be darker than
the previous group. Zero indicates that each successive group of
risers will be shaded exactly the same as the previous group.
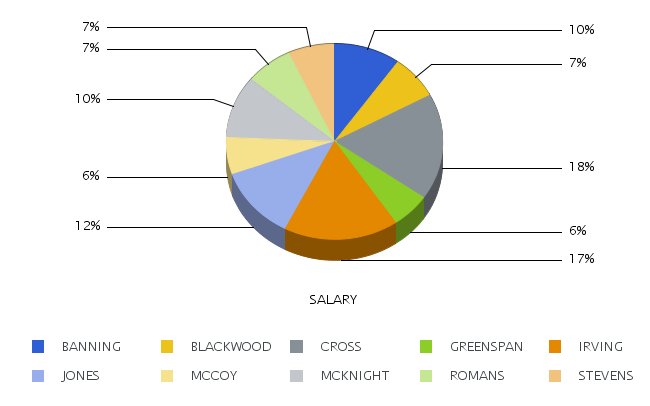
Example: Implementing Automatic Repeated Riser Shading in a Pie Chart
The following implements repeated lightening
of groups of risers. It sets the color mode to 4, the series looping
index to 5, and the automatic color factor to 1:
-*Autoshade base on every 5 series
setColorMode(4);
setSeriesLooping(5);
setAutoColorLerpFactor(1);
-*
ENDSTYLE
ON GRAPH SET STYLE *
INCLUDE=IBFS:/CFG/FILE/IBI_HTML_DIR/javaassist/intl/EN/ENIADefault_combine.sty,$
ENDSTYLE
END
On the output, the riser
colors repeat after five car values because the looping index is 5:
- The riser color for JONES is a lighter version of the riser
color for BANNING.
- The riser color for MCCOY is a lighter version of the riser
color for BLACKWOOD.
- The riser color for MCKNIGHT is a lighter version of the riser
color for CROSS.
- The riser color for ROMANS is a lighter version of the riser
color for GREENSPAN.
- The riser color for STEVENS is a lighter
version of the riser color for IRVING.
x
Syntax: How to Implement Automatic Gradient Riser Coloring
You
can automatically create a gradient color effect between the risers
in a graph. You implement this type of coloring by setting the color
mode to 5, setting a starting color for the gradient, and setting
an ending color for the gradient:
setColorMode(5);
setAutoColorGradientStartColor({Color.start_color|new Color(r1,g1,b1)});
setAutoColorGradientEndColor({Color.end_color|new Color(r2,g2,b2)});
where:
- setColorMode(5);
Implements automatic gradient riser shading.
- start_color
Identifies the starting color for the gradient.
- (r1,g1,b1)
Is the code for the red, green, and blue components of the
starting color.
- end_color
Identifies the ending color for the gradient.
- (r2,g2,b2)
Is the code for the red, green, and blue components of the
ending color.
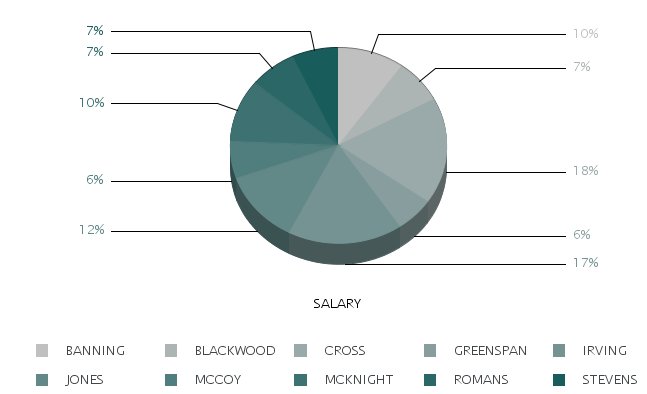
Example: Implementing Automatic Gradient Riser Coloring
The following implements automatic gradient
riser coloring. It sets the color mode to 5, the start color to
dark gray (192,192,192) and the end color to green (25,92,92):
-*Gradient effect
setColorMode(5);
setAutoColorGradientStartColor(new Color(192,192,192));
setAutoColorGradientEndColor(new Color(25,92,92));
-*
ENDSTYLE
ON GRAPH SET STYLE *
INCLUDE=IBFS:/CFG/FILE/IBI_HTML_DIR/javaassist/intl/EN/ENIADefault_combine.sty,$
ENDSTYLE
END
On the output, the riser
colors form a gradient from the start color (dark gray) to the end
color (green):