Graph-Specific Properties and Methods
The topics in this section describe properties and methods
specific to 3D cubes, pie graphs, stock graphs, bubble graphs, funnel
graphs, multi-Y axis graphs, Pareto graphs, and waterfall graphs.
x
When you select a 3D graph type with the GraphType property,
use these properties to control the appearance of the 3D cube:
- CubeFocusFactor
(0...100); This property sets the focus factor for setting perspective
distortion in a 3D graph.
- CubeIsometricProjection
(true/false); This property enables (true)/disables (false) isometric
projection.
- CubeLightSourceX/Y/Z
(0...100); These properties set the cube light source for the X-,
Y-, and Z-coordinates (unit space).
- CubeProportional(true/false);
Define the axis size proportional to the number of series (false)
or groups (true).
- CubeRiserInterpolation();
This property controls whether risers in 3D graphs are interpolated
(faster) or explicitly calculated (more accurate).
- CubeSizeX/Y/Z
(0...100); These properties set the size of the 3D cube in the (user) X-,
Y-, and Z-directions.
- CubeTranslationX/Y/Z
(0...100); These properties set the translation of a 3D cube (in
3D cube coordinates) in the X-, Y-, and Z-direction.
- CubeViewerX/Y/Z
(0...100); These properties set the viewer location (in 3D coordinates)
in the X-, Y-, and Z-direction.
- CubeWallThickX/Y/Z
(0...100); These properties set the thickness of the 3D-cube wall
in the (user) X-, Y-, and Z-direction.
- CubeZoomFactor
(0...100); This property sets the global scaling factor for zooming in/out.
- Display3DFloor
(true/false); This property enables/disables the display of the
floor of the cube in a 3D graph.
- Display3DLeftWall
(true/false); This property enables/disables the display of the left
wall of the 3D cube.
- Display3DRightWall
(true/false); This property enables/disables the display of the right
wall of the 3D cube.
- Viewing3DAnglePreset
(-1...15); This property selects an entry in the table of preset viewing
angles for 3D graphs.
|
-1=
|
Custom (as set by CubeViewerX/Y/Z, CubeWallThickX/Y/Z,
and so on)
|
|
0=
|
Standard (the default)
|
|
1=
|
Tall and Skinny
|
|
2=
|
From the Top
|
|
3=
|
Distorted
|
|
4=
|
Short and Fat
|
|
5=
|
Groups Eye
|
|
6=
|
Group Emphasis
|
|
7=
|
Few Series
|
|
8=
|
Few Groups
|
|
9=
|
Distorted Standard
|
|
10=
|
Shorter and Fatter
|
|
11=
|
Thick Wall for Series
|
|
12=
|
Thick Wall Standard
|
|
13=
|
California Special
|
|
14=
|
Blast-O-Vision
|
|
15=
|
Special
|
Graph Types and 3D Preset Viewing Angles includes an illustration of each of these
preset viewing angles. Also see 3D Grid Lines and Riser and Marker Properties for information about properties that you
can use to control the appearance of grid lines and risers in the
3D cube.
xPie Graph Properties and Methods
When you select a pie graph is selected with the GraphType
property, you can use these properties and methods to control attributes
that are specific to a pie graph:
- OtherPercentage(0...100%);
This property sets the percentage at which a slice in a pie graph
will be grouped into the other slice when the OtherSeries property
is enabled.
- OtherSeries(true/false);
This property enables/disables the bundling of small slices (less
than OtherPercentage) into a single slice that is labeled other.
- PieDepth (0...100);
This property specifies the depth of the pie crust in a pie graph or
a funnel graph. 30 is the default value.
- PieFeelerTextDisplay
(0...3); This property enables (true)/disables (false) the display
of feelers and data text in a pie graph.
- PieFeelerTextFormat
(0...14); This property determines the format of values that are
drawn next to feelers in a pie graph.
- PieLabelDisplay
(0...3); This property determines the format of labels displayed next
to feelers in a pie graph. 1 is the default value.
- PieRingSize
(0...100); This property determines the size of the ring (inner
circle) in a ring pie. 30 is the default value.
- PieRingTotalDisplay
(true/false); This property enables (true)/disables (false) the display
of a total value in the center of a pie ring graph.
- PieRingTotalFormat:
When the PieRingTotalDisplay property is set to true and the total
data value is displayed in the center of a ring pie graph, this
property sets the format of the data value.
- PieRotate (0...359);
This property rotates a pie or funnel graph a specified number of
degrees. 0 is the default value.
- PieSorting(0...3);
This property defines the order in which pie slices are drawn.
- PiesPerRow (integer);
This property specifies the number of pies to be drawn in a row
in multi-pie graphs. 2 is the default value.
- PieTilt (0...100);
This property tilts a pie or funnel graph a specified number of degrees.
15 is the default value.
- PieBarSeries
(0...# of Series in graph); This property selects the series that
will be used to map the bar in a pie-bar graph. 0 is the default
value.
- get/setPieSliceDelete();
These methods get/set a boolean value indicating whether or not
slices have been deleted from a pie graph.
- get/setPieSliceDetach();
These methods get/set the distance that slices are detached from
a pie graph.
- restoreAllSlices();
This method restores all detached/deleted slices from a pie graph.
- isChartPieType();
This method returns a boolean indicating whether or not the GraphType
property is set to one of the pie graphs.
xStock Graph Properties and Methods
When you select a stock graph with the GraphType property,
use these properties and methods to control attributes that are
specific to a stock graph:
- DataTextTemplateHiLo;
This property assigns a special format macro to data text labels
when they are enabled for display in a stock graph.
- Stock52WeekHighValue();
This property gets and sets the 52-week high value assigned to a
stock graph.
- Stock52WeekLowValue()
This property gets and sets the 52-week low value assigned to a
stock graph.
- Stock52WeekHighDisplay
(true/false); This property enables (true)/disables (false) the
display of a 52-week high line in a stock graph.
- Stock52WeekLowDisplay
(true/false); This property enables (true)/disables (false) the
display of a 52-week low line in a stock graph.
- StockCloseSplitDisplay
(true/false); This property enables (true)/disables (false) the
display of split risers at the stock close value.
- StockCloseTicksDisplay
(true/false); This property enables (true)/disables (false) the
tick marks at the stock close value.
- StockMovingAverageDisplay
(true/false); This property enables (true)/disables (false) the
display of a moving average line in a stock graph.
- StockOpenTicksDisplay
(true/false); This property enables (true)/disables (false) the
tick marks at the stock open values.
- StockTickLength
(Integer); This property determines the length of tick marks in
a stock graph.
- ViewableGroupsStock:
This property specifies the maximum number of groups to be imaged
in a stock graph.
- ViewableSeriesStock:
This property specifies the maximum number of series to be imaged
in a stock graph.
- isChartStockType();
This method returns a boolean indicating whether or not the GraphType
property is set to one of the stock graphs.
xBubble Graph Properties and Methods
The following properties and methods format special
items that are only available in bubble graphs:
- DataTextTemplateBubble:
This property assigns a special format macro to data text labels
when they are enabled for display in a bubble graph.
- QuadrantLineCountX:
This property selects a number of quadrant lines on the X-axis in
a bubble graph.
- QuadrantLineCountY:
This property selects a number of quadrant lines on the Y-axis in
a bubble graph.
- getQuadrantLine();
This method gets the object ID of the quadrant lines in a bubble graph.
- getQuadrantLineValueX();
This method gets the vertical location of an X quadrant line.
- getQuadrantLineValueY();
This method gets the horizontal location of a Y quadrant line.
- setQuadrantLineValueX();
This method sets the vertical location of an X quadrant line.
- setQuadrantLineValueY();
This method sets the horizontal location of a Y quadrant line.
xFunnel Graph Properties and Methods
A funnel graph is basically a pie graph that shows only
one group of data at a time. The series in the group are stacked
in the funnel with the first series at the top and the last series
at the bottom.
Example:
Use the following methods to define the initial setup of a funnel
graph:
setTransparentBorderColor(getFrame(), true);
setDisplayFunnelGroup(int nGroup); // Group to show
setGraphType(106);
You must set which group of data you wish to display.
The funnel graph contains graph specific objects:
- Feelers.
- Funnel value
labels.
- Funnel labels
(frequently referred to as the series labels).
The following methods return the object ID of these funnel graph
objects:
getFunnelFeeler()
getFunnelValueLabel()
getFunnelLabel()
The following property defines which group to display in the
funnel graph. 0 is the default value.
setDisplayFunnelGroup(int nGroup)
The following property defines the location of labels in a funnel
graph.
setFunnelLabelValueLocation(int nLocation)
where:
- nLocation
Can be set to a value in the range 0...2. 0 is the default value.
0= | Labels on top of values drawn on the right
of the funnel. |
1= | Labels on the left of the funnel/Values
on the right of the funnel. |
2= | Values on the left or the funnel/Labels
on the right of the funnel. |
The following pie graph properties can be used in funnel graphs:
- setPieDepth(0...100);
Sets the depth of the funnel graph. 30 is the default value.
- setPieRotate(0...259);
Sets the length of the funnel tip. 50 is the default value.
- setPieTilt(0...100);
Sets the amount of tilt toward the viewer.
For every funnel graph, it is recommended that you set the transparent
border color of the graph frame to true. This overrides the default
behavior (normally false for other graph types) of showing a black
rectangle around the frame and will create a better looking funnel graph.
setTransparentBorderColor(getFrame(), true)
To change the color of the funnel feeler, use setBorderColor().
For example:
setBorderColor(getFunnelFeeler(), Color.red)
xGauge Graph Properties & Methods
When the GraphType property selects a gauge graph (setGraphType(110)), the
following properties can be used to modify the appearance of the
graph:
- GaugeBackgroundStyle;
Defines the style of the gauge background.
- GaugeDescending;
Draw gauge values in ascending or descending order.
- GaugeIgnoreBackgroundStyle;
Ignore/obey the GaugeBackgroundStyle property.
- GaugeMajorAutoStep;
Enable/disable automatic calculation of the number of major grid/tick
steps. If this property is disabled (FALSE), Y1MajorGridStep defines
the number of major grid steps.
- GaugeMajorTickRelativeTickLength;
Get/set the relative length of major ticks.
- GaugeMinorAutoStep;
Enable/disable automatic calculation of the number of minor grid/tick
steps. If this property is disabled (FALSE), Y1MinorGridStep defines
the number of minor grid steps.
- GaugeMinorTickRelativeTickLength;
Get/set the relative length of minor ticks.
- GaugeNeedleStyle;
Get/set the gauge needle style.
- GaugeRelativeInnerRadius;
Get/set the relative size of the inner radius.
- GaugeRelativeThickness;
Get/set gauge's relative thickness.
- GaugeStartAngle;
Get/set gauge start angle.
- GaugeStopAngle;
Get/set gauge stop angle.
- GaugeTitlePosition;
Set the title positioning. See How to Set the Title Postion in a Gauge Chart.
The setFontSize...() methods can be used to modify the size of
gauge labels. For example:
IdentObj identObj = getGaugeLabel();
setFontSizeAbsolute( identObj, true );
setFontSize( identObj, 9 );
The setTextFormatPreset() method can be used to change the format
of gauge labels:
IdentObj identObj = getGaugeLabel();
setTextFormatPreset( identObj , 5 /*$0*/ );
The setURL() method also works with gauges. A URL can be attached
to a gauge (multi gauge graph) as shown in the following example:
IdentObj identObj = getGaugeBackground();
// group 1
identObj.setGroupID(1);
setURL( identObj,
"http:://www.google.com" );
Also see the Gauge Graph objects.
x
Syntax: How to Set the Title Postion in a Gauge Chart
setGaugeTitlePosition(int);
where:
-
int
-
Is a value from 1-3:
1 places the title below the chart.
2
places the title in the center (this is the default).
3 places
the title above the chart.
x
Syntax: How to Control the Display of the Value in the Gauge Chart
setDisplay(getGaugeValue(), newValue);
where:
- newValue
-
Is either true or false.
When newValue is
true, the gauge value displays on the gauge background; when it
is false, the value is not displayed. The default is true.
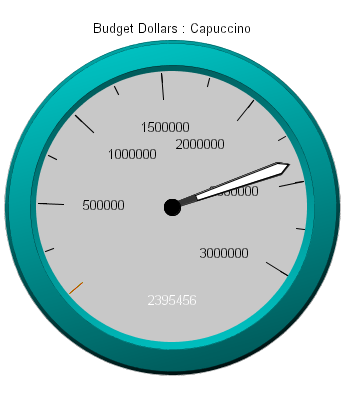
Example: Controlling the Display of
the Value in the Gauge Chart
GRAPH FILE GGSALES
SUM GGSALES.SALES01.BUDDOLLARS
ACROSS GGSALES.SALES01.PRODUCT
WHERE (GGSALES.SALES01.PRODUCT EQ 'Capuccino');
ON GRAPH SET LOOKGRAPH GAUGE1
ON GRAPH SET GRAPHEDIT SERVER
ON GRAPH SET GRAPHSTYLE *
setTextFormatPreset(getY1Label(),1);
setDisplay(getGaugeValue(), true);
setPlace(true);
ENDSTYLE
END
The graph displays as the following:
x
Syntax: How to Control the Display of the Minimum Value on the Gauge Scale
setY1ExcludeMinLabel(newValue);
where:
- newValue
-
Is either true or false.
When newValue is
true, the minimum label is not displayed on the gauge scale; when
it is false, the minimum value displays. The default is false.
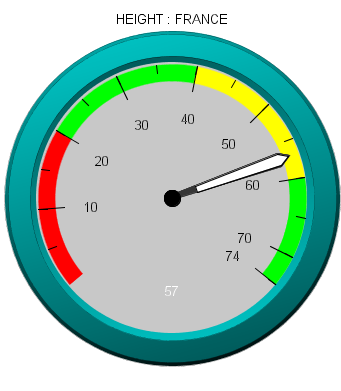
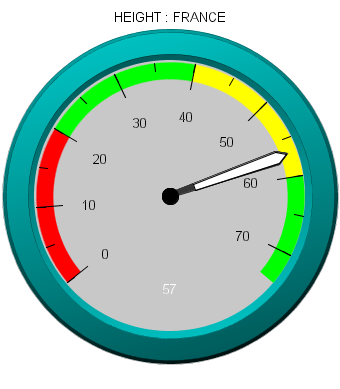
Example: Controlling the Display of
the Minimum Value on the Gauge Scale
GRAPH FILE CAR
SUM HEIGHT
ACROSS CAR.ORIGIN.COUNTRY
WHERE (CAR.ORIGIN.COUNTRY EQ 'FRANCE');
ON GRAPH SET LOOKGRAPH GAUGE1
ON GRAPH SET GRAPHEDIT SERVER
ON GRAPH SET GRAPHSTYLE *
setY1ExcludeMinLabel(true);
setPlace(true);
ENDSTYLE
END
The graph displays as the following:
x
Syntax: How to Control the Display of the Maximum Value on the Gauge Scale
setY1ExcludeMaxLabel(newValue);
where:
- newValue
-
Is either true or false.
When newValue is
true, the maximum label is not displayed on the gauge scale; when
it is false, the maximum value is displayed. The default is false.
Example: Control the Display of the
Maximum Value on the Gauge Scale
GRAPH FILE CAR
SUM HEIGHT
ACROSS CAR.ORIGIN.COUNTRY
WHERE (CAR.ORIGIN.COUNTRY EQ 'FRANCE');
ON GRAPH SET LOOKGRAPH GAUGE1
ON GRAPH SET GRAPHEDIT SERVER
ON GRAPH SET GRAPHSTYLE *
setY1ExcludeMaxLabel(true);
setPlace(true);
ENDSTYLE
END
The graph displays as the following:
xMulti-Y Axes Graph Properties and Methods
In addition to dual-axes graphs, 3Y-, 4Y-, and 5Y-axes
graphs (GraphType 103...105) are also available.
Example:
Series must be assigned to the axes using setAxisAssignment().
setAxisAssignment(getSeries(0), 1);
setAxisAssignment(getSeries(1), 2);
setAxisAssignment(getSeries(2), 3);
setAxisAssignment(getSeries(3), 4);
setGraphType(105)
By default, the series risers assigned to each axis are staggered.
The AlignMultiYBars property can be used to align the bars on each
axis.
By default, axis labels are staggered with odd numbered (1/3/5)
axis labels on the left and even numbered (2/4) axis labels on the
right. These default settings can be changed with setAxisSide().
Example:
setAxisSide(getY3Axis(),1); //Y3 Axis on Right
setAxisSide(getY4Axis(),0); //Y4 Axis on Left
The size of each axis can be changed using the following method:
setAxisSize(IdentObj id, int newValue)
where:
- newValue
Is 0...100. 1 (automatic) is the default value.
Example:
setAxisSize(getY1Axis(), 20);
If the AxisSize is set to 0 (automatic) for all axes, automatic
sizing of axes and offsets will occur. This is the default setting
for each axis. In other words, axes and offsets will be sized proportionally
dividing the available space of the frame evenly. If an even distribution between
each axis is desired, there is no need to set the axis size or the
axis offset.
x
Syntax: How to Set the Axis Offset From the Base of the Frame
The
axis offset from the base of the frame can also be set using the
following method:
setAxisOffset(IdentObj id, int newValue);
where:
-
newValue
-
Is 0...100. 0 is the default value.
Example:
setAxisOffset(getY1Axis(), 20);
With
this feature, axes are allowed to overlap. In most cases this may
not be a desirable effect. If the axis sizes are set to non-zero
values, appropriate relationships between the offsets and sizes
must be set.
setAxisOffset(getY1Axis(), 0);
setAxisOffset(getY2Axis(), 20);
setAxisOffset(getY3Axis(), 40);
setAxisOffset(getY4Axis(), 50);
setAxisOffset(getY5Axis(), 80);
setAxisSize(getY1Axis(), 20);
setAxisSize(getY2Axis(), 20);
setAxisSize(getY3Axis(), 10);
setAxisSize(getY4Axis(), 30);
setAxisSize(getY5Axis(), 20);
The percentages of available
frame space in this example are:
- 20% for the
Y1 axis
- 20% for the
Y2 axis
- 10% for the
Y3 axis
- 30% for the
Y4 axis
- 20% for the
Y5 axis
The following methods return the object ID of
the Y3-, Y4-, and Y5-axis titles:
getY3Title()
getY4Title()
getY5Title()
Example:
The following displays
the Y3-axis title:
setTextString(getY3Title(), "Y3 Title");
setDisplay(getY3Title(), true);
xPareto Graph Properties and Methods
When you select a Pareto graph (GraphType 102), the
X-axis scale is for group numbers. The Y-axis scale is the percent
of the total accumulation for each selected series. Each graph displays
a single series. Use the DisplayParetoSeries property to define the
single series to be shown in the Pareto graph.
Example:
setDisplayParetoSeries (1);
setGraphType(102);
The default Pareto series is zero.
The ParetoDisplayThreshold property can be used to split the
frame and accumulation line per the desired percent. (1...100).
1 (no split) is the default.
Example:
SetParetoY2MajorGridStep(5);
The ConnectParetoBars property can be used to connect/disconnect
the bars in a Pareto graph.
xWaterfall Graph Properties and Methods
When you select a waterfall graph (GraphType 100 (vertical)
or 101 (horizontal)), groups within the graph are identified as
subtotals, totals, or extra. The waterfall graph automatically performs
the cumulative sum when using subtotal or total. Groups labeled
as extra are ignored in waterfall calculations.
Note: Values in a given group in a stacked waterfall must
be all negative or all positive. Zero is treated as a positive number.
If the data contains mixed signs, the sign of the first series controls
whether the entire stack will be treated as all positive or all negative.
See Data in a Waterfall Graph for more information about setting up the data required
for a waterfall graph and restrictions.
The following methods can be used to select a vertical or horizontal
waterfall graph:
setGraphType(100); // WATERFALL_VERT = 100;
setGraphType(101); // WATERFALL_HORZ = 101;
The setWaterfallGroupMode() method assigns each group in the
data set to be graphed as a normal, a subtotal, total, or extra
group.
void setWaterfallGroupMode(int nGroup, int nGroupMode);
where:
- nGroup
Is a group number.
- nGroupMode
Can be one of the following:
int WATERFALLGROUPMODE_NORMAL = 0;
int WATERFALLGROUPMODE_SUBTOTAL = 1;
int WATERFALLGROUPMODE_TOTAL = 2;
int WATERFALLGROUPMODE_EXTRA = 3;
By default the group mode is set to normal. If a waterfall group
is set to subtotal or total, the data for this group is ignored
and the cumulative total up to this point is shown for this group.
Only one group can be designated as total or extra. Total is computed
the same way as a subtotal except there is only one of them. For
the best visual presentation, the group designated as extra should
be the last group in the graph. A group designated as extra is not
used in performing any waterfall cumulative sums. It appears as
stacked data.