How to: Reference: |
The NORMSDST function performs calculations on a standard normal distribution curve, calculating the percentage of data values that are less than or equal to a normalized value. A normalized value is a point on the X-axis of a standard normal distribution curve in standard deviations from the mean. This is useful for determining percentiles in normally distributed data.
The NORMSINV function is the inverse of NORMSDST. For information about NORMSINV, see NORMSINV: Calculating Inverse Cumulative Normal Distribution.
The results of NORMSDST are returned as double-precision and are accurate to 6 significant digits.
A standard normal distribution curve is a normal distribution that has a mean of 0 and a standard deviation of 1. The total area under this curve is 1. A point on the X-axis of the standard normal distribution is called a normalized value. Assuming that your data is normally distributed, you can convert a data point to a normalized value to find the percentage of scores that are less than or equal to the raw score.
You can convert a value (raw score) from your normally distributed data to the equivalent normalized value (z-score) as follows:
z = (raw_score - mean)/standard_deviation
To convert from a z-score back to a raw score, use the following formula:
raw_score = z * standard_deviation + mean
The mean of data points xi, where i is from 1 to n is:

The standard deviation of data points xi, where i is from 1 to n is:

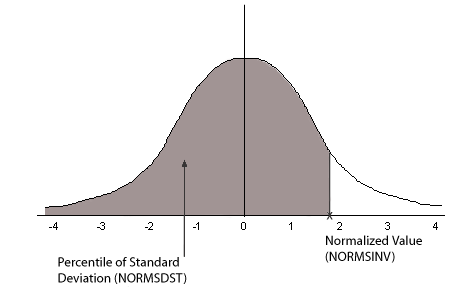
The following diagram illustrates the results of the NORMSDST and NORMSINV functions.

Many common measurements are normally distributed. A plot of normally distributed data values approximates a bell-shaped curve. The two measures required to describe any normal distribution are the mean and the standard deviation:
- The mean is the point at the center of the curve.
- The standard deviation describes the spread of the curve. It is the distance from the mean to the point of inflection (where the curve changes direction).
NORMSDST(value, 'D8');where:
- value
Is a normalized value.
- D8
Is the required format for the result. The value returned by the function is double-precision. You can assign it to a field with any valid numeric format.
NORMSDST finds the percentile for Z and stores the result in a column with the format D8.
NORMSDST(Z, 'D8')
For -.07298, the result is .47091.
For -.80273 the result is .21106.