Document
view allows you to build multiple reports and charts on the same
canvas. The styling, design, and report building functionality of
Live Preview and Query Design view is available in Document view.
In
addition, there are many other features that simplify building
documents. You can build and insert multiple reports in the form
of reports and charts into documents. You can also insert images
and text for presentation and organizational purposes.
xInserting Reports From Multiple Data Sources
With
InfoAssist opened in Document view, you can insert multiple charts
and reports onto the canvas. These reports can be from different
data sources. With documents, you have the option to add additional
data sources to the document.
In order to insert
reports from different data sources, the document must have multiple data
sources loaded. For more information on adding
and switching between data sources, see Data Tab.
Note: You cannot use multiple
data sources when working with a Reporting Object.
x
Procedure: How to Insert Two Reports From Two Different Data Sources
A document
can display multiple reports from multiple data sources in the
same document.
-
With InfoAssist
open in Document view, insert a chart or report.
-
If your
document has only one data source, insert additional data sources.
For more detailed instructions on inserting
multiple data sources, see Data Tab.
-
Switch to
a data source different than the one used in step 1.
For more detailed instructions on switching
to a different data source, see Data Tab.
-
Insert
a chart or report using this new data source, following the instructions
given in Inserting a New Report.
Your document is now populated with reports that have data
from different data sources. You can add as many data sources as
you need.
x
With
InfoAssist opened in Document view, you can insert multiple charts
and reports onto the canvas. The procedures in the following sections
detail how to insert reports into documents.
In Document view, you can insert
a report in the following ways.
- Use the Insert tab.
- Double-click a data
source field.
- Right-click a data
source field.
- Drag and drop a data
source field onto the canvas.
Note: When you
use the Insert tab, double-click a data source field, or right-click
a data source field, a report placeholder is inserted in the upper-left
corner of the canvas.
Dragging and dropping a data source
field onto the canvas inserts the place holder at the location you
dropped it.
The following procedures describe how to insert
new reports. For more information on how to edit existing reports,
see How to Style and Customize a Report.
x
Procedure: How to Insert a Report With the Insert Tab
The
Insert tab is only available to insert reports in Document view.
For more information on the Insert tab, see Insert Tab.
-
With InfoAssist
open in Document view, click the Insert tab.
-
In the Reports
group, click Report.
A report placeholder appears in the upper-left corner of
the canvas.
You can now add fields to the report using the
canvas and the Resources panel. For more information on how to use
the Resources panel to add additional fields to the report, see Understanding the Resources Panel.
x
Procedure: How to Insert a Report With Drag and Drop
You
can insert a report by dragging data source fields from the Resources
panel onto the canvas in Document view. To insert a report, make
sure that Report is selected on the Format tab, in the Destination
group. This option is also on the Home tab, in the Format group.
-
With InfoAssist
open in Document view, click the Format tab.
-
In the Destination
group, click Report.
Note: You can also click Report from the Home tab,
in the Format group.
-
Select a
data source field from the Data pane in the Resources panel and
drag it onto the canvas. Make sure that you drop the data source
field onto an open area of the canvas and not on top of another
chart or report.
A report with the selected data source appears in
the Results panel, as shown in the following image.
-
You can
now add fields to the report using the canvas and the Resources
panel. For more information on how to use the Resources panel to
add additional fields to the report, see Understanding the Resources Panel.
x
Procedure: How to Insert a Report With Double-Click
You
can double-click a data source field in the Resources panel in
Document view. To insert a report, make sure that no report is actively
selected on the canvas and Report is selected on the Format tab,
in the Destination group. This option is also on the Home tab, in
the Format group.
Note: You cannot insert a new report
by a double-click if a report is actively selected. If a report
is selected, click the canvas to deselect the report and make the
canvas the active object.
-
With InfoAssist
open in Document view, click the Format tab.
-
In the Destination
group, click Report.
Note: You can also click Report on the Home tab,
in the Format group.
-
Double-click
a data source field in the Data pane of the Resources panel.
A report with the selected data source appears in the Results
panel, as shown in the following image.
-
You can
now add fields to the report using the canvas and the Resources
panel. For more information on how to use the Resources panel to
add additional fields to the report, see Understanding the Resources Panel.
x
Procedure: How to Insert a Report With Right-Click
You
can insert reports by right-clicking a data source field in the Resources
panel in Document view. To insert a report, make sure that no report
is actively selected on the canvas and Report is selected on the
Format tab, in the Destination group. This option is also on the
Home tab, in the Format group.
Note: You cannot insert
a new report by a right-click if a report is actively selected.
If a report is selected, click the canvas to deselect the report
and make the canvas the active object.
-
With InfoAssist
open in Document view, click the Format tab.
-
In the Destination
group, click Report.
Note: You can also click Chart on
the Home tab, in the Format group.
-
Right-click
a data source field in the Data panel.
A menu opens.
-
Select from
the following menu options:
- Sum
- Sort
- Across
- Include as Coordinated
- Filter
- Slicers
A report with the selected data source appears in
the Results panel.
x
With
InfoAssist opened in Document view, you can bring multiple charts
and reports onto the canvas. The procedures in the following sections describe
how to insert charts into documents.
In
Document view, you can insert a chart in the following ways:
- Use the Insert tab.
- Double-click a data
source field.
- Right-click a data
source field.
- Drag and drop a data
source field from the Resources panel onto the canvas.
Note: When
you use the Insert tab, double-click a data source field, or right-click
a data source field, a chart placeholder is inserted in the upper-left
visible portion of the canvas.
Dragging and dropping a data
source field onto the canvas inserts the place holder at the location
you dropped it.
The following procedures describe how to insert
new charts. For more information on how to edit existing charts,
see How to Style and Customize a Chart.
x
Procedure: How to Insert a Chart With the Insert Tab
The
Insert tab is only available to insert charts in Document view. For more information on the Insert tab, see Insert Tab.
-
With InfoAssist
open in Document view, click the Insert tab.
-
In the Reports
group, click Chart.
A chart placeholder appears in the upper-left corner
of the canvas.
You can now add fields to the chart using the
canvas and the Resources panel. For more information on how to use
the Resources panel to add additional fields to the report, see Understanding the Resources Panel.
x
Procedure: How to Insert a Chart With Drag and Drop
You
can insert a chart by dragging data source fields from the Resources
panel and dropping them onto the canvas in Document view. To insert
a chart, make sure that Chart is selected
on the Format tab, in the Destination group. This option is also
on the Home tab, in the Format group.
-
With InfoAssist
open in Document view, click the Format tab.
-
In the Destination
group, click Chart.
Note: You can also click Chart on the Home tab,
in the Format group.
-
Select a
data source field from the Data pane in the Resources panel and
drag it onto the canvas. Make sure that you drop the data source
field onto an open area of the canvas and not on top of another
chart or report.
A chart placeholder with the selected data source
appears in the Results panel, as shown in the following image.
-
You can
now add fields to the chart using the canvas and the Resources panel.
x
Procedure: How to Insert a Chart With Double-Click
You
can double-click a data source field in the Resources panel in
Document view. To insert a chart, make sure that no report is actively
selected on the canvas and Chart is selected on the Format tab,
in the Destination. This option is also on the Home tab, in the
Format group.
Note: You
cannot insert a new chart by a double-click if a report is actively selected.
If a report is selected, click the canvas to deselect the report
and make the canvas the active object.
-
With InfoAssist
open in Document view, click the Format tab.
-
In the Destination
group, click Chart.
Note: You can also click Chart on
the Home tab, in the Format group.
-
Double-click
a data source field in the Data pane of the Resources panel.
A chart placeholder with the selected data source appears
in the Results panel, as shown in the following image.
-
You can
now add fields to the chart using the canvas and the Resources panel.
For more information on how to use the Resources panel to add additional
fields to the report, see Understanding the Resources Panel.
x
Procedure: How to Insert a Chart With Right-Click
You
can insert charts by right-clicking a data source field in the Resources
panel in Document view. To insert a chart, make sure no report
is actively selected on the canvas and Chart is selected on the
Format tab, in the Destination group. This option is also on the
Home tab, in the Format group.
Note: You cannot insert
a new chart by a right-click if a report is actively selected. If
a report is selected, click the canvas to deselect the report and
make the canvas the active object.
-
With InfoAssist
open in Document view, click the Format tab.
-
In the Destination
group, click Chart.
Note: You can also click Chart on
the Home tab, in the Format group.
-
Right-click
a data source field in the Data panel.
A menu appears.
-
Select from
the following menu options:
xInserting an Existing Report
With
InfoAssist opened in Document view, you can insert existing charts
and reports onto the canvas from the Insert tab. The following procedure describes
how you can insert reports into new documents and documents that
are already populated with reports, text, and images.
x
Procedure: How to Insert an Existing Report With the Insert Tab
You
can create a document in the Custom Reports section of the domain
and use Standard Reports items as Existing Report components. You
cannot use other Custom Report items as components.
-
With InfoAssist
open in Document view, click the Insert tab.
-
In the Reports
group, click Existing Report.
An Open dialog box appears.
-
Browse to
the report that you want to insert and click OK.
The report appears in the upper-left corner of the canvas.
Hovering
the mouse over an existing report displays the report title as a tooltip.
Note: You
cannot edit an existing report that is inserted into a document.
xCreating a Document From a Single Report
You
can take a single report created in Live Preview or Query Design
view and convert it into a document, displaying it in Document view.
When you convert
a single report into a document, the original report is preserved
and a copy of that report is opened as a document in Document view.
You can then add additional reports, charts, images, and text.
xInserting Text and Images
With
InfoAssist opened in Document view, you can bring text and images
onto the canvas. The following procedures describe how you can
insert text and images into new documents and documents that are
already populated with reports, text, and images.
Note: You
can only do this in Document view.
The following procedures detail how
to insert text and images. For more information on how to edit existing
text and images, see Editing Components in a Document.
x
Procedure: How to Insert Text
-
With InfoAssist
open in Document view, click the Insert tab.
-
In the Objects
group, click Text Box.
A text component appears in the upper-left corner of the
canvas with default text, as shown in the following image.
-
Double-click,
or right-click, the text component to edit the text.
For more information on editing and styling the text,
see How to Edit Text.
x
Procedure: How to Insert an Image
-
With InfoAssist
open in Document view, click the Insert tab.
-
In the Objects
group, click Image.
An Open dialog box appears.
-
Browse to
the desired image and click OK.
The selected image appears in the upper-left corner of
the canvas.
xEditing Components in a Document
The
reports, controls, and text in a document can be edited, moved,
resized, and deleted. Each of these components has a context menu
which can be accessed by right-clicking the component.
Images
can be moved, resized, and deleted, but they have no context menu
and cannot be edited. Right-clicking a image brings up the option
to delete it.
x
Procedure: How to Resize a Component
You
can resize a component in the following ways:
- Using the component
sizing handles.
- Changing the height
and width on the Layout tab, in the Size & Arrange group.
- Accessing the options
on the Size tab in the Size and Position dialog box.
The
resize feature is available for all components that can be added
to a document.
-
Open or
create a document with at least one report, text component, control,
or image.
-
Resize the component in one of the
following ways:
-
Sizing Handles: Select
the component and drag the sizing handles that appear around it,
as shown in the following image. As you manually increase the height
and width of the component, the new values appear in the corresponding
text boxes in the Size & Arrange group of the Layout tab.
-
Ribbon: You
can use the ribbon in one of the following ways:
- Select the component
in the document. On the Layout tab, in the Size & Arrange group,
enter values in the Height and Width fields.
- On the Layout tab,
in the Size & Arrange group, click the dialog box launcher
 on the
lower-left side of the group, to open the Size and Position dialog
box.
on the
lower-left side of the group, to open the Size and Position dialog
box.
-
Right-Click Menu: Right-click
the component and select Size and Position.
The Size and Position dialog box opens.
From the Size and
Position dialog box, open the Size tab, as shown in the following image.
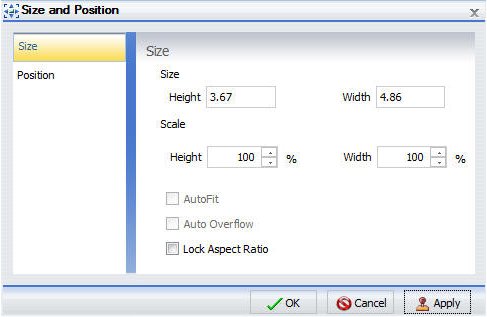
Use
the Height and Width options to change the position of the selected component.
You can adjust the pixel size of the object with the Size options
or the scale percentage of the object with the Scale options.
You
can lock the aspect ratio using the Aspect Ratio button, which is
available when working with charts, images, and text boxes while
working in Document view. With the aspect ratio locked, changing
the width automatically changes the height to keep the component
to scale, and changing the height automatically changes the width.
Note: The
Auto Overflow option is only available while working with reports
in Document view through the Size & Arrange group. With Auto
Overflow set, you cannot manually set the height and width of a
report. The area of the report expands automatically to show all
data.
The AutoFit option is only available for charts through
the Size & Arrange group. With AutoFit set, the chart size becomes
dynamic. This means that other applications can override the size
of the chart when the chart is embedded.
When two objects
are selected, the Relative Position button
sets the bottom-left corner of the component that is higher on the
page to the upper-left corner of the one that is lower. Once a relationship
is created, arrows appear to show that relationship while both items
are still selected.
x
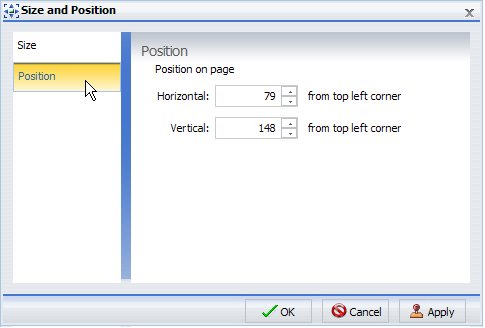
Procedure: How to Move a Component
You
can move a component by clicking it, or by accessing the Position
section of the Size and Position dialog box. This feature is available
for all components that can be added to a document.
You can also align components
with each other so that their horizontal or vertical position matches.
For more information, see How to Align Components.
-
Open or
create a document with at least one report, text component, control,
or image.
-
Select the component and move it by
using one of the following methods:
x
Procedure: How to Align Components
You
can align components with each other so that their horizontal or
vertical positions match. You must have multiple components selected
to use the align options.
The alignment is anchored by the
component that is in the farthest position of the selected alignment.
For example, if you select two components and click Align Left,
the components align horizontally with the component farthest to
the left.
-
Open or
create a document with at least two components.
-
Select a
component.
-
Select a
second component by holding the Ctrl key and clicking a component.
Note: You can select multiple components simultaneously
by holding the Ctrl key and with the left mouse dragging a selection
box around the components. When you release the mouse, sizing handles
appear around each component that you selected.
Sizing handles appear around the components, as shown in
the following image.
-
Align the components using one of the
following methods:
-
Right-click one
of the selected components and select an alignment option from the
Align drop-down menu, as shown in the following image.
or
-
Access the alignment
options from the Align drop-down menu. The menu is available on
the Layout tab, in the Size & Arrange group, as shown in the
following image.
The
selected components align, as shown in the following image.
-
Click anywhere
in the canvas to deselect the components.
x
Procedure: How to Style and Customize a Report
When
you select a component, you can perform various functions on the
component, such as moving and resizing it, as explained in How to Move a Component. After clicking a component, you can use
the ribbon to affect all settings of the selected component, except
for fields. You can double-click or right-click a component to select
individual fields to edit through the context menu or Field tab.
In addition
to reports, you can style and customize charts and text. For more information
on charts, see How to Style and Customize a Chart. For more information on text, see How to Edit Text.
Note: Images cannot be edited.
-
Open or
create a document with at least one report.
-
Select the
report.
Sizing handles appear around the border.
Note:
The groups of the Field tab are unavailable
-
Right-click
the report, and click Edit Report, as shown
in the following image.
Note: You can also activate the report by double-clicking
it. This action provides the same functionality as right-clicking
and then clicking Edit Report.
-
You can
now select fields within the report. Select a field by clicking
it in the canvas.
Note: The groups on the Field tab are now available,
as shown in the following image.
Note: You
can also select a field within the report by clicking the field
in the Query pane of the Resources panel. Make sure that the report
that contains the field you would like to edit is selected on the
canvas.
You can now edit the selected report using commands
available through the context menu or the ribbon.
For more information on styling and customizing reports,
see Creating and Customizing Reports.
x
Procedure: How to Style and Customize a Chart
When
you select a component, you can perform various functions on the
component, such as moving and resizing it, as explained in How to Move a Component. After clicking a component, you can use
the ribbon to affect all settings of the selected component, except
for fields. You can double-click or right-click a component to select
individual fields to edit through the context menu or Field tab.
In addition to
charts, you can style and customize reports and text. For more information
on reports, see How to Style and Customize a Report. For more information on text, see How to Edit Text.
Note: Images
cannot be edited.
-
Open or
create a document with at least one chart.
-
Select the
chart.
Sizing handles appear around the border, as shown in the
following image.
Note: The groups of the Field tab
are unavailable.
-
Right-click
the chart, and click Edit Chart, as shown
in the following image.
Note: You
can also activate the chart by double-clicking it. This action provides
the same functionality as right-clicking, and then clicking Edit Report.
-
You can
now select fields within the chart. Select a field by clicking
it in the canvas.
Note: The groups on the Field tab are now available,
as shown in the following image.
Note: You
can also select a field within the chart by clicking the field in the
Query pane of the Resources panel. Make sure that the chart that
contains the field you would like to edit is selected on the canvas.
You
can now edit the selected chart using commands available through
the context menu or the ribbon.
For more information on
styling and customizing charts, see Creating and Customizing Charts.
x
Procedure: How to Edit Text
When
you select a component, you can perform various functions on the
component, such as moving and resizing it, as explained in How to Move a Component. After clicking a component, you can use
the ribbon to affect all settings of the selected component, except
for fields. You can double-click or right-click a component to select
individual fields to edit through the context menu or Field tab.
In addition to editing text, you
can style and customize reports and charts. For more information
on reports, see How to Style and Customize a Report. For more information on charts, see How to Style and Customize a Chart.
Note: Images cannot
be edited.
-
Open or
create a document with at least one text component.
-
Select the
text.
Sizing handles appear around the border, as shown
in the following image.
-
Right-click
the text, and click Edit Text, as shown in
the following image.
Note: You
can also activate the context menus by double-clicking the text.
This actions provides the same functionality as right-clicking,
and then clicking Edit Text.
A cursor appears over the text.
-
Click anywhere
in the text box and begin entering text.
-
Highlight
the text you would like to edit, and right-click it. A menu of options
appears.
-
Using the
menu options, you can style the text and insert quick text.
The text component menu options are as follows:
-
Font. Opens
a list of available fonts for the selected text.
-
Size. Opens
a list of available text sizes for the selected text.
-
Bold. Formats
the selected text in bold.
-
Italic. Formats
the selected text in italics.
-
Underline. Underlines
the selected text.
-
Text color. Opens
the Color dialog box where you can select a color for the selected
text.
-
Cut. Cuts
the selected text.
-
Copy. Copies
the selected text to the clipboard.
-
Paste. Pastes
the selected text from the clipboard.
-
Date. Opens
a list of date quick text in various formats.
-
Time. Opens
a list of time quick text in various formats.
-
page #. Opens
a list of page number quick text in various formats.
x
Procedure: How to Delete a Component
The
following procedure applies to all components in Document view.
-
Open or
create a document with at least one component.
-
Right-click
the component and click Delete.
The component is deleted from the canvas.
Note: You
can also delete a component by clicking it and pressing the Delete key.