Formatting Gridlines

In this section:

Gridlines are used on a chart as a reference to help you understand the quantities and values of your data and decode information on the axis. There are four types of gridlines that you can display and edit on your chart. They are:

Major gridlines enhance the display of values, while minor gridlines supplement major gridlines. If a plot point falls in between major gridlines, you can use minor gridlines for more precise interpretation of the data.

Note: The orientation of a chart determines the available gridline options.


Top of page

x
Format Grid Lines Dialog Box

Whether you access gridline options from the ribbon, or the right-click menu, you are presented with the Format Grid Lines dialog box of options to format horizontal and vertical gridlines, color bands, and frames on a chart.

Color bands come in a pair, with each band uniquely colored. They appear in a continually repeating pattern behind a series on a chart. The contrast of colors is designed to make the chart easier to read.

Alternate formatting can be used to apply different colors to sections, called regions, of an axis.

The Format Grid Lines dialog box contains the following tabs:

Note: The Color Bands and the Frames options are not available in InfoAssist Basic.

Use the Major Grid Lines tab to format the major gridlines on the chart. The Major Grid Lines tab is shown in the following image.

Format Grid Lines Dialog Box Major Grid Lines Tab

The Major Grid Lines tab contains the following options:

Use the Minor Grid Lines tab to format the minor gridlines on your chart. The Minor Grid Lines tab is shown in the following image.

Format Grid Lines Dialog Box Minor Grid Lines Tab

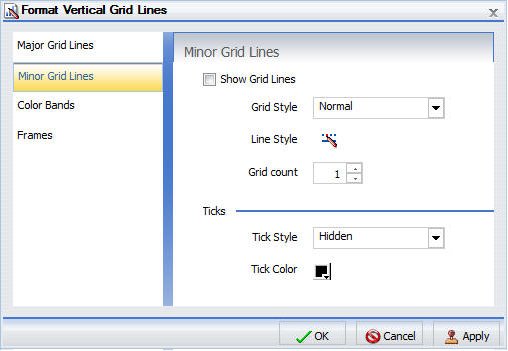
The Minor Grid Lines tab contains the following options:

Use the Color Bands tab to format the color bands on your chart. The Color Bands tab is shown in the following image.

Format Grid Lines Dialog Box Color Bands Tab

The Color Bands tab contains the following options:

Use the Quadrant Lines tab to control the placement and style of the quadrant lines in your scatter and bubble chart. The Quadrant Lines tab is shown in the following image.

Format Grid Lines Dialog Box Quadrant Lines Tab

The Quadrant Lines tab contains the following options:

Use the Frames tab to enable or disable frame regions, and to set the location and style of the frame text. The Frames tab is shown in the following image.

Format Grid Lines Dialog Box Frames Tab

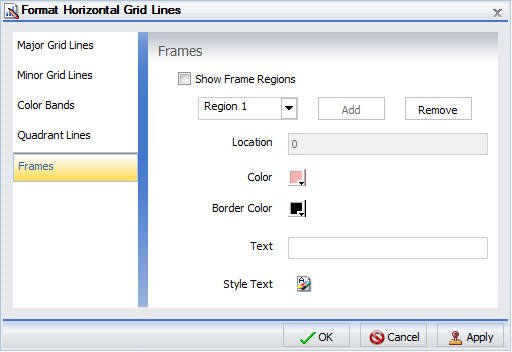
The Frames tab contains the following options:

For instructions on how to open this dialog box, see the procedures in Using Gridline Properties.


Top of page

x
Gridline Elements Right-Click Menu

When you right-click a gridline on a chart, a menu of options opens. The options for the gridline elements are described in the following table.

Element

Option

Description

Horizontal Major Gridlines

Horizontal Minor Gridlines

Vertical Major Gridlines

Vertical Minor Gridlines

Delete

Removes the gridline from the chart and updates the Live Preview accordingly.

Set Line Color

Enables you to specify the color of the gridline, using the Color dialog box. For more information, see Color Dialog Box.

More Grid Lines Options

Opens the Format Gridlines dialog box. For more information, see Format Grid Lines Dialog Box.


x
Using Gridline Properties

In this section:

The following sections contain procedures for customizing gridlines. The procedures are organized by the tab and group in which their associated options appear on the ribbon.


x
Format Tab Features Group


x
Procedure: How to Display Horizontal Major Gridlines

If your chart does not display gridlines by default, use this procedure to generate gridlines.

  1. Create a chart.
  2. On the Format tab, in the Features group, open the Grid drop-down menu, point to Horizontal Gridlines, and then select Major Gridlines.

    The Format Horizontal Grid Lines dialog box opens.

  3. On the Major Grid Lines tab, select Show Major Grid Lines.

    Horizontal major gridlines are added to the chart.

    The following image shows a chart with the horizontal major gridlines highlighted and the right-click menu open.

    Horizontal Major Gridlines


x
Procedure: How to Display Horizontal Minor Gridlines
  1. Create a chart.
  2. Access the option to show gridlines in one of the following ways:
    • Ribbon: On the Format tab, in the Features group, open the Grid drop-down menu. On the Grid drop-down menu, point to Horizontal Gridlines, and then select Minor Gridlines.
    • Right-Click Menu: Right-click the chart, and select More Grid Line Options. The Format Horizontal Grid Lines dialog box opens. On the Minor Grid Lines tab, select Show Minor Grid Lines.

    Horizontal minor gridlines are added to the chart.

    The following image shows a chart with the horizontal minor gridlines highlighted.

    Bar Chart With Horizontal Minor Gridlines Highlighted


x
Procedure: How to Display Vertical Major Gridlines
  1. Create a chart.
  2. Access the option to show gridlines in one of the following ways:
    • Ribbon: On the Format tab, in the Features group, open the Grid drop-down menu. On the Grid drop-down menu, point to Vertical Gridlines, and then select Major Gridlines.
    • Right-Click Menu: Right-click the chart, and select More Grid Line Options. The Format Vertical Grid Lines dialog box opens. On the Major Grid Lines tab, select Show Major Grid Lines.

    Vertical major gridlines are added to the chart.

    The following image shows a chart with the vertical major gridlines highlighted and the right-click menu open.

    Bar Chart With Vertical Major Gridlines Highlighted and the Right Click Menu Open


x
Procedure: How to Display Vertical Minor Gridlines
  1. Create a chart.
  2. Access the option to show gridlines in one of the following ways:
    • Ribbon: On the Format tab, in the Features group, open the Grid drop-down menu. On the Grid drop-down menu, point to Vertical Gridlines, and then select Minor Gridlines.
    • Right-Click Menu: Right-click the chart, and select More Grid Line Options. The Format Vertical Grid Lines dialog box opens. On the Minor Grid Lines tab, select Show Minor Grid Lines.

    Vertical minor gridlines are added to the chart.

    The following image shows a chart with vertical minor gridlines highlighted.

    Bar Chart WIth Vertical Minor Gridlines Highlighted


x
Procedure: How to Set the Color, Weight, and Style of a Gridline
  1. Open the Format Grid Lines dialog box in one of the following ways:
    • Ribbon: On the Format tab, in the Features group, open the Grid drop-down menu, point to the gridline type that you want to format, and select More Grid Lines Options.
    • Right-Click Menu: Right-click a gridline, and select More Grid Lines Options.

    The Format Grid Lines dialog box opens.

  2. Click the Line Style icon.

    The Line Style dialog box opens.

  3. Set the color, weight, and style of the gridline.
  4. Click OK to close the Line Style dialog box.
  5. Click OK again to close the Format Grid Lines dialog box.

    The gridline is formatted accordingly.

    The following image shows a chart with the default styling for gridlines.

    Chart With Default Gridlines Styling

    The following image shows the same chart with the gridlines styled as red, dashed lines, of medium weight.

    Chart With Red Dashed Medium Weight Gridlines


x
Procedure: How to Set Ticks

Ticks are short lines which are perpendicular to a gridline. They are used to tick off specific increments along the gridline.

  1. Create a chart with gridlines.
  2. Open the Format Grid Lines dialog box in one of the following ways:
    • Ribbon: On the Format tab, in the Features group, open the Grid drop-down menu, point to the gridline type that you want to format, and select More Grid Lines Options.
    • Right-Click Menu: Right-click a gridline, and select More Grid Lines Options.

    The Format Grid Lines dialog box opens.

  3. From the Tick Style drop-down menu select a tick style option. The options are:
    • Hidden
    • Inside
    • Outside
    • Spanning
  4. Click the Color icon to open the Color dialog box, where you can set the color of the tick marks.
  5. Click OK to close the Color dialog box.
  6. Click OK again to close the Format Grid Lines dialog box.

    The tick marks are formatted accordingly.

    The following image shows a chart with tick marks spanning the frame of the chart.

    Chart With Tick Marks Spanning the Frame


x
Procedure: How to Set Color Bands
  1. Create a chart with gridlines.
  2. Open the Format Grid Lines dialog box in one of the following ways:
    • Ribbon: On the Format tab, in the Features group, open the Grid drop-down menu, point to gridlines that you want to format, and select More Grid Lines Options.
    • Right-Click Menu: Right-click a gridline, and select More Grid Lines Options.

    The Format Grid Lines dialog box opens.

  3. On the Color Bands tab, click the Color icon to open the Color dialog box, where you can set the color of the color bands.
  4. Use the transparency slider, or the percentage box, to type or select the percentage of the transparency that you want to apply to the color.
  5. Click OK to close the Color dialog box.
  6. Click OK again to close the Format Grid Lines dialog box.

    The following image shows a chart with Color Band 1 set to a green color with 80 percent transparency.

    Chart With Green Color Band of 80 Percent Transparency


x
Procedure: How to Delete a Gridline
  1. Create a chart with gridlines.
  2. Select a gridline.
  3. Delete the gridline in one of the following ways:
    • Ribbon: On the Format tab, in the Features group, open the Grid drop-down menu. From the menu, point to the gridline that you want to format, and select More Grid Lines to open the Format Grid Lines dialog box. On the tab for the gridline that you want to delete, clear the Show Grid Lines option, and click OK.
    • Right-Click Menu: Right-click the gridline, and from the menu, select Delete.

    The gridline is deleted from the chart.


x
Procedure: How to Display Quadrant Lines

Use the options on the Quadrant Lines tab to control the placement and style of the quadrant lines in your scatter and bubble chart.

Note: Quadrant lines are on by default for bubble charts and off by default for scatter charts.

The following image show a scatter chart without quadrant lines.

Scatter Chart Without Quadrant Lines

  1. Create a scatter chart.
  2. On the Format tab, in the Features group, click Grid.
  3. On the drop-down menu, point to either Horizontal Gridlines or Vertical Gridlines, and then click More Grid Lines Options.

    The Format Grid Lines dialog box opens.

  4. On the Quadrant Lines tab, select Show Quadrant Line. The quadrant line displays on the chart.
  5. Click OK to close the Format Grid Lines dialog box.

    The following image shows the same chart with quadrant lines.

    Scatter Chart With Quadrant Lines


WebFOCUS