Creating a Basic Report

In this section:

How to:


Top of page

x
Procedure: How to Create a Report From the BI Portal Tree

After you have signed in to the BI Portal, you can work with an existing folder, or create a new folder in the tree to store your reports.

  1. Right-click the folder that you want to use, point to New, and then click Report.

    The Select a data source dialog box opens, as shown in the following image.
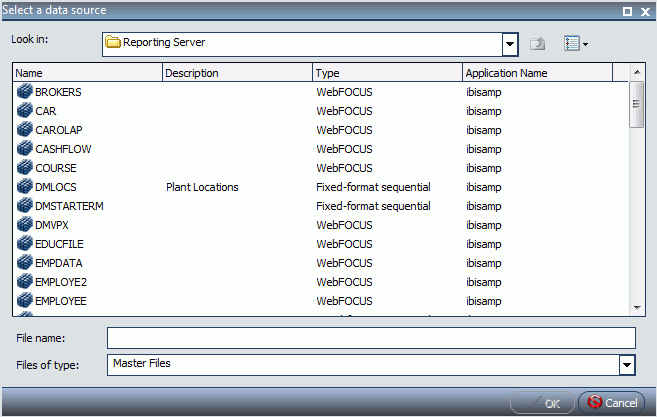
    Select a data source dialog box

  2. From the Select a data source dialog box, select the data source that you want to use, and click OK.

    The data source that you selected appears in the Data pane of the Resources panel.

  3. Drag and drop fields onto the canvas or into the Query pane to begin building your report.

    A basic report is shown in the following image.
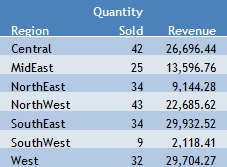
    Basic Report


Top of page

x
Procedure: How to Create a Report From the Application Main Menu
  1. In the upper-left corner of the InfoAssist interface, click the IA button to open the Application Menu.
  2. From the Application Main Menu, click New.

    The InfoAssist splash screen opens.

  3. On the InfoAssist splash screen, select Build a Report.

    The Select a data source dialog box opens.

  4. From the Select a data source dialog box, select the data source that you want to use, and click OK.

    The data source that you selected appears in the Data pane of the Resources panel.

  5. Drag and drop fields onto the canvas or into the Query pane to begin building your report.

Top of page

x
Procedure: How to Create a Report From the Quick Access Toolbar
  1. On the Quick Access Toolbar, click the New icon.

    The InfoAssist splash screen opens.

  2. On the InfoAssist splash screen, select Build a Report.

    The Select a data source dialog box opens.

  3. From the Select a data source dialog box, select the data source that you want to use, and click OK.

    The data source that you selected appears in the Data pane of the Resources panel.

  4. Drag and drop fields onto the canvas or into the Query pane to begin building your report.

Top of page

x
Procedure: How to Create a Report From an Existing Chart
  1. Open the chart that contains the data that you want to present in a report.
  2. On the Home tab, in the Format group, click Report.

    The data is presented as a report.


Top of page

x
Report Outputs

The following output types are available for reports:

Note: When you create a report in Document view, you have access to Excel only.

When you create a report in Live Preview or Query Design view you have access to the following Excel output types:


WebFOCUS