Generating Overflow Sheets for an Excel 2000 Report

How to:

Creating a report with the Excel 2000 format generates a fully styled Excel report in your browser, enabling you to render most StyleSheet report options. By default, when you choose Excel 2000 as your output format, the report opens in an Excel 2000 worksheet, identified in a tab at the bottom of the spreadsheet as Sheet 1, Sheet2, and so on. You can control where the overflow rows of data break in the Excel worksheet by using the Generate overflow sheets option. The default is 65,000 rows of data before an overflow sheet is generated.

Generate overflow sheets is available as a worksheet option on the Format tab of the Report Options dialog box, when Excel 2000 (EXL2K) is selected as the output format in Report Painter.

Note: Selecting the Generate overflow sheets option adds the SET LINES syntax to your report.


Top of page

x
Procedure: How to Generate Overflow Sheets for an Excel 2000 Report
  1. In Report Painter, confirm that Excel 2000 (EXL2K) is selected as the output format in the Report Options dialog box.
  2. Select the worksheet option Generate overflow sheets on the Format tab of the Report Options dialog box, and type the rows per sheet.

    Note: The default rows per sheet is 65,000. This indicates that overflow sheets are generated after 65,000 rows of data.

  3. Click OK to close the Report Options dialog box and run the report.

    In the following example, the Excel worksheet starts to generate the overflow data after 2500 rows on Sheet 2, as indicated from the rows per sheet set on the Format tab.

    generate overflow sheets in Excel output

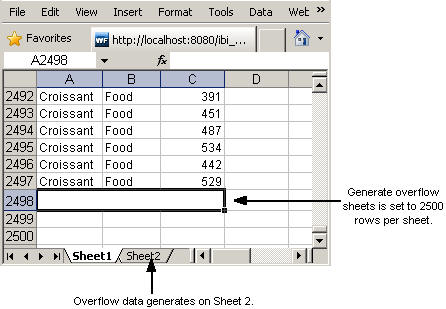
    Note: The first two rows of the Excel report are heading and column title rows.


WebFOCUS