TYPE=DATA,[COLUMN|ACROSSCOLUMN=Nn,]COLOR=color,[WHEN=expression,]
FOCEXEC=fex[(parameters ...),]$
where:
- DATA
Identifies Data as the graph component to which the user is applying the color. The TYPE attribute and its value must appear at the beginning of the declaration.
- COLUMN|ACROSSCOLUMN
Is the graph subcomponent to which you want to apply color. Valid graph subcomponents are COLUMN and ACROSSCOLUMN.
- color
Identifies the color that you want to apply to the graph component or subcomponent. For a list of valid colors, see Formatting Report Data.
- Nn
Identifies a column by its position in the report. To determine this value, count BY fields, display fields, and ROW-TOTAL fields, from left to right, including NOPRINT fields. For more information, see Identifying a Report Component in a WebFOCUS StyleSheet.
- FOCEXEC=fex
Identifies the file name of the linked procedure to run when a user selects the report object.
- parameters
Are values to be passed to the procedure. You can pass one or more values, using any combination of the following methods:
- You can specify a constant value, enclosed in single quotation marks.
- You can specify the name or the position of a graph column.
- You can specify the name of a Dialogue Manager amper variable to pass its value.
- You can use amper variables only in inline StyleSheets.
Note: The usual use of an amper variable is to pass a constant value, in which case, it would have to be embedded in single quotation marks. For example:
'&ABC'.
The method you can use to pass values can vary, depending on the method you use to execute the hyperlink. You can pass one or more values. The entire string of values must be enclosed in parentheses, and separated from each other by a blank space.
- expression
Is any Boolean expression that specifies conditions for applying the specified color to the graph component. The expression must be valid on the right side of a COMPUTE command. For details, see Using Expressions.
Note: IF ... THEN ... ELSE logic is not necessary in a WHEN clause and is not supported.
All non-numeric literals in a WHEN expression must be specified within single quotation marks.
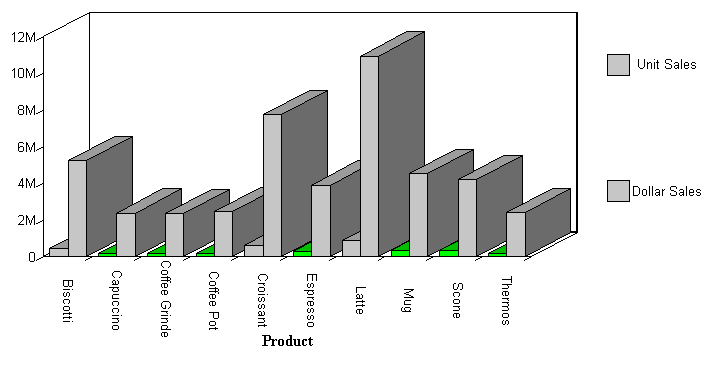
In this example, when the value for UNITS is less than four hundred thousand, the color is lime and you can drill-down to a detail report.
GRAPH FILE GGSALES
SUM UNITS DOLLARS ACROSS PRODUCT
ON GRAPH SET STYLE *
TYPE=DATA,COLOR=SILVER,$
TYPE=DATA,ACROSSCOLUMN=N1,COLOR=LIME,WHEN=N1 LT 400000,FOCEXEC=GRAPH2,$
ENDSTYLE
END
The output is:
