The following topics describe and show details of the
measure-related views that are available as drill-down options.
Note: In reports that show aggregated measures, measure
data might be distinctly counted. This means that items, such as
staff, tools, or machinery that moves from location to location
are not counted twice when totaling at higher levels.
x
When you click an Objective drill-down hyperlink and
select Show Measures (Curr vs. Prev), the
drill down takes you to the Show Measures view, which displays the
heading Measures - Compare to Previous. In this view, current measures
(Percent Reached, Target, Actual) are compared to previous measures
for the selected objective, as shown in the following image.
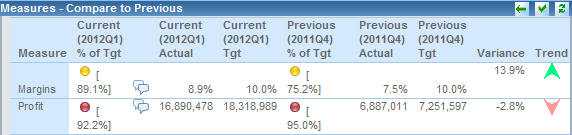
This view compares data for current and previous time periods
which can be year over year, quarter over quarter, or month to previous
month depending on the time window that is configured. PMF also
provides measures for the previous year total, same quarter in previous
year, and same month in previous year.
From the Show Measures view, you can select the Measure Details drill-down
option in any of the columns displaying Current and Previous data.
This option takes you to another view that provides statistical
data at the lowest atomic measure level for the related metric.
For details, see Measure Details.
The Show Measures view also enables you to drill into the properties
for any item in the Measure column to display additional views that
show how the measure was loaded, what calculations were used to
create it, and so on. To display additional data related to a measure,
click a hyperlinked item in the Measure column and select the desired
option. For a list of the available drill-down options, see Measure Drill-Down Options.
x
When you click a drill-down hyperlink, for example,
in the Show Measures view, and select Measure Details,
the drill down takes you to Measure Detail Data, as shown in the
following image. This view provides statistical data at the lowest
atomic measure level for the related metric.
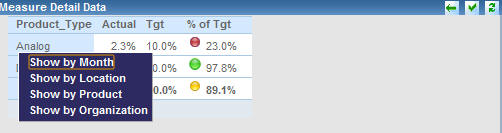
From Measure Detail Data, you have access to different dimensional
cross-drill data views by clicking a hyperlink in the first column
and selecting from the drill-down options. The options vary, depending
on how your own dimensions are set up.
In the preceding example, the options
are:
-
Show by Month. The view is reformatted
to show data by month.
-
Show by Location. The
view is reformatted to show data by location.
-
Show by Product. The
view is reformatted to show data by product.
-
Show by Organization. The
view is reformatted to show data by organization.
x
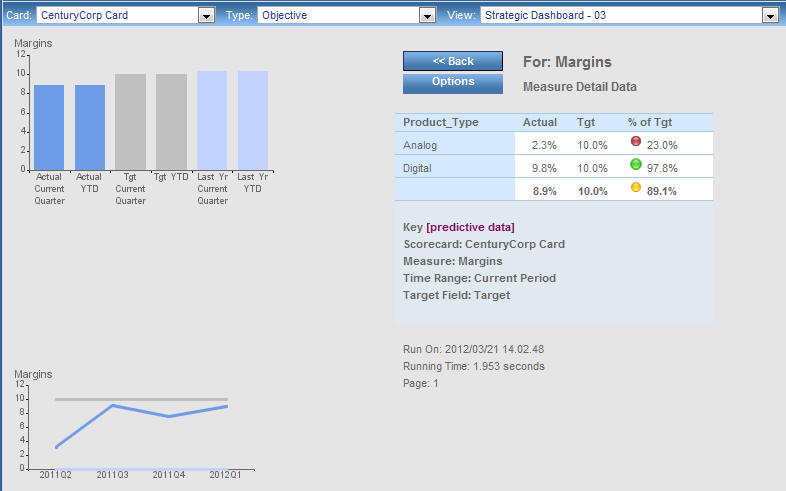
When you click a measure drill-down hyperlink and select Measure
Breakout, the drill down takes you to the Measure Breakout
view. This view provides actual, target, and percent reached measure
data with graphs displaying current period and year-to-date trends
for actual, target, and prior year performance. You can also view
additional measure properties in a pop-over panel by clicking the
zoom button in the upper-right corner of the view. An example of
the Measure Breakout view for the Sales measure is shown in the
following image.
A Measure Breakout view is also available in PDF format for print
output in the Analytics tab. To access it, select Analysis or Measures Detail from
the Type drop-down menu, select Measure Breakout Booklet
- PDF from the View drop-down menu.
x
When you click a drill-down hyperlink and select Operational Report,
the drill down takes you to the view that was set up by your administrator,
as shown in the following image.
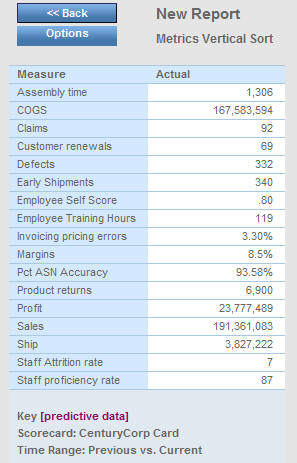
For any project, process, objective, or measure, your administrator
can set up a WebFOCUS report as your operational report. This enables
you to link PMF to external reports.