In this section: |
The following new features apply to InfoAssist reports, charts, and documents.
As of Release 8.0 Version 04, new aggregation functionality is available in InfoAssist. Within functionality allows you to use specific aggregation tasks at different report levels. You can use the Within phrase to manipulate display field values as they are aggregated within a sort group, rather than a report column.
In the following image, the output on the left shows the percentage distribution for the entire column, whereas the output on the right shows aggregation within a region.

Note: You can have a maximum of two Within phrases. The first applies to By fields and the second applies to Across fields.
-
With a report open, in the Query Design
pane, select the numeric measure data source field.
The Field tab appears on the ribbon.
-
On the Field tab, in the Display group, click Within,
as shown in the following image.
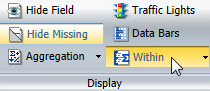
Note: Depending on how your data is set up, you can apply the Within phrase on a By or Across field.
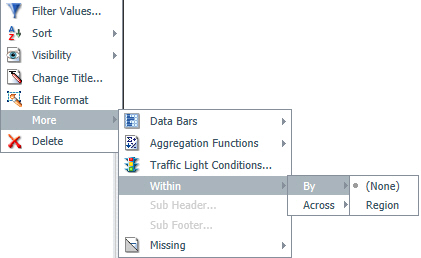
Optionally, you can access the Within functionality from the right-click menus on the column level, as shown in the following image. You can also access these menus when you right-click on an operator (for example, SUM) in the Query pane.
-
On the Within menu, click the down arrow to select the
Within phrase for the By or Across field, as shown in the following
image.
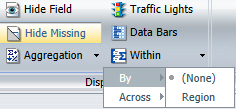
- Select a By or Across field from the list of available fields.
- Run the report to view output.
Note: As of WebFOCUS Release 8.0 Version 02, subquery filter functionality is available in InfoAssist.
HOLD files are a mechanism for storing temporary output files on the WebFOCUS Reporting Server. The life span of these files can range from very transient, such as files saved in the EDATEMP directory of a reporting agent for use in the same procedure (FEX), to longer lasting files containing precalculated or presummarized data that may be run nightly and used throughout the following day.
HOLD files are required for various reports and constructs. One such use is when a developer requires specific sort fields in a report and they are in a multi-path structure. The developer may create a HOLD file to drop the multi-path structure and then report off the HOLD file to get the desired report. HOLD files can be created to use in a report, chart, document, or dashboard.
In InfoAssist, you can create a subquery using a HOLD file. A subquery is a nested query, which is added to the Where clause of an SQL statement. A subquery is valuable because it is reusable.
For more information on subquery filters using a HOLD file, see the InfoAssist User’s Manual.
InfoAssist Basic is a modern, web-based facility that provides comparable functionality to legacy reporting tools. InfoAssist Basic contains many of the features of InfoAssist, while still allowing you to create and edit reports and charts as you would with a legacy tool.
You can click the Accessibility button, in the Format tab, to add a title to a report, chart, or document that is Section 508 compliant. This option is only available for reports and charts when the output type is HTML or PDF. For documents, the output type must be set to PDF.
In the Business Intelligence Portal, accessibility mode is on by default for Section 508 users. Non-Section 508 users must click the Accessibility On link in the BI Portal banner to enable accessibility. The Accessibility button is shown in the following image.

You can add new conditional styling or modify existing conditional styling by applying traffic light colors to a selected field in the output when the field meets specific criteria. You can also create drilldowns for conditions. The Traffic Lights button, in the Display group under the Field tab, opens the Traffic Light Condition dialog box. For more information related to reports, see How to Apply Traffic Light Conditional Styling to Data in a Report in the WebFOCUS InfoAssist User’s Manual. For more information related to charts, see How to Apply Traffic Light Conditional Styling to a Chart in the WebFOCUS InfoAssist User’s Manual.
The Missing Data menu enables you to control the display of missing data values in a chart. The Display group, under the Data tab, provides access to the Missing Data menu, as shown in the following image.

When you select the Missing Data button, a drop-down menu appears, as shown in the following image.
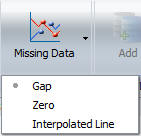
When you select Gap and you are using a bar, line, or area chart, missing values appear as a gap in the chart.
When you select Zero and you are using a bar chart, a bar appears on the zero line. If you are using a line chart, a solid line connects the missing value with the succeeding value. For an area chart, the area appears on the zero line.
When you select Interpolated Line and you are using a line graph, missing values will appear as an interpolated dotted line that connects the plot points preceding and succeeding the missing value. When using bar or area graphs, missing values will display as an interpolated bar or area chart.

 .
.