Sample Application Overview
The sample application called Retail Predictives is
packaged in the orlando.zip archive. This application is
designed to determine predicted sales across specific geographic
areas (census blocks) in Orlando, FL, which are identified by Federal
Information Processing Standard (FIPS) codes. Each FIPS code identifies:
- Population difference (per square mile) between 2000 and
2010
- Median age
- Store count
The following business types are being represented in this sample
application:
- Convenience Store
- Department Store
- Electronics Store
- Gas Station
- Grocery Store
- Men’s Clothing Store
- Shoe Store
- Sporting Goods Store
- Women’s Clothing Store
This section describes how to access and begin exploring the
functionality of the Retail Predictives sample application.
x
Procedure: How to Access the Retail Predictives Sample Application
-
Unzip the orlando.zip archive to a location
on your file system.
-
Copy the folder called orlando to the following
directory of your WebFOCUS installation
drive:\ibi\apps
where:
- drive
Is the location where WebFOCUS is installed.
For
example:
drive:\ibi\apps\orlando
-
Ensure the WebFOCUS Reporting Server is started.
-
Enter the following URL in a web browser:
http://localhost:8080/approot/orlando/retail_sales_v5.htm
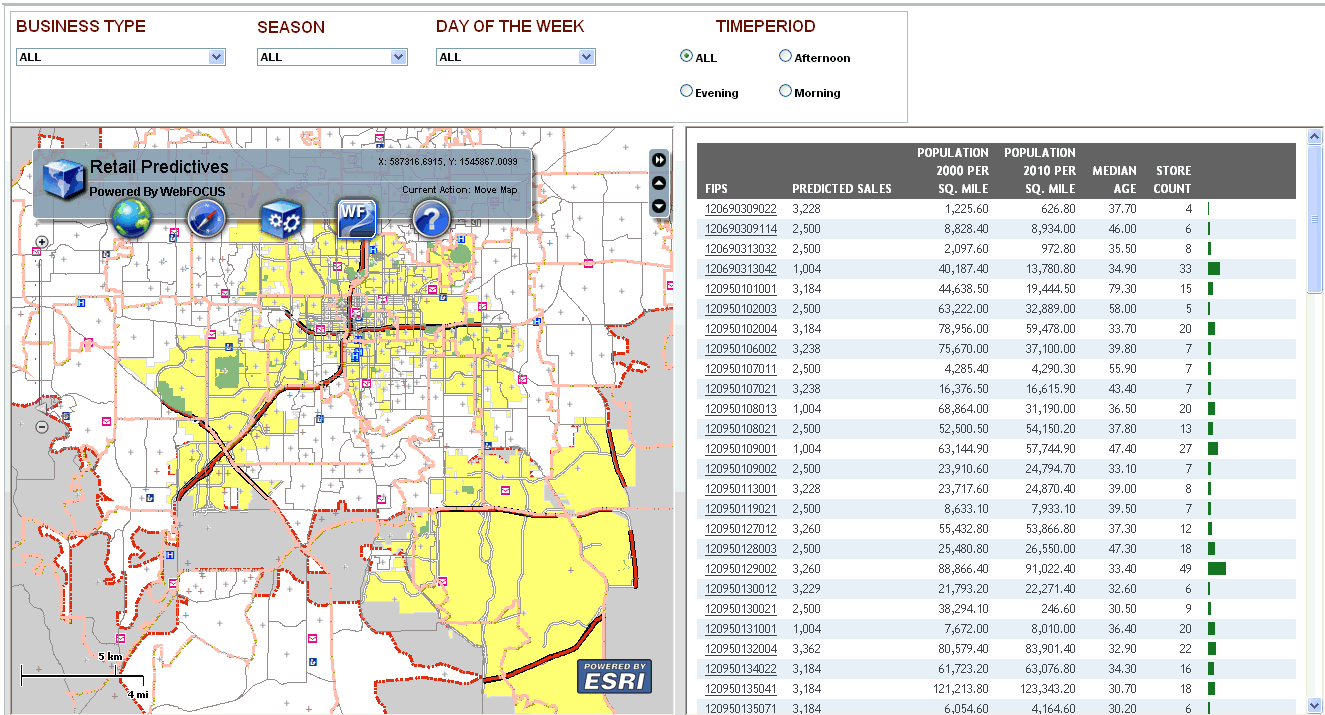
The
WebFOCUS GIS Viewer for Flex opens and displays the Retail Predictives application,
as shown in the following image.
x
Procedure: How to Use the Available Drill-Down Options for a FIPS Code
-
Click a FIPS code in the right pane,
as shown in the following image.
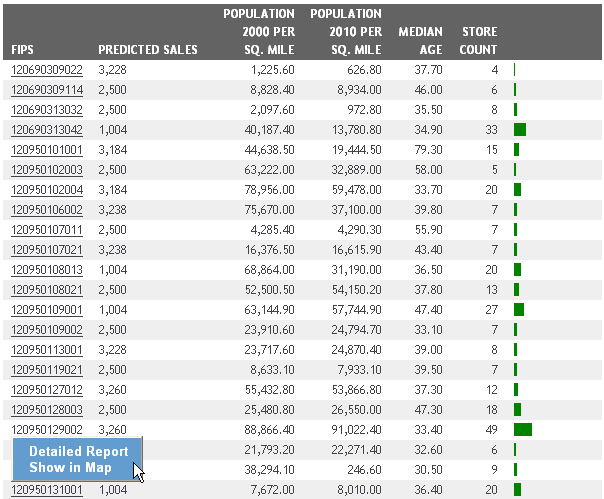
Select one of the
following drill-down options from the context menu that is displayed:
-
Detailed Report
-
Show in Map
-
Click Detailed Report.
In the right pane, the predicted values for the selected
FIPS code are displayed, as shown in the following image.

-
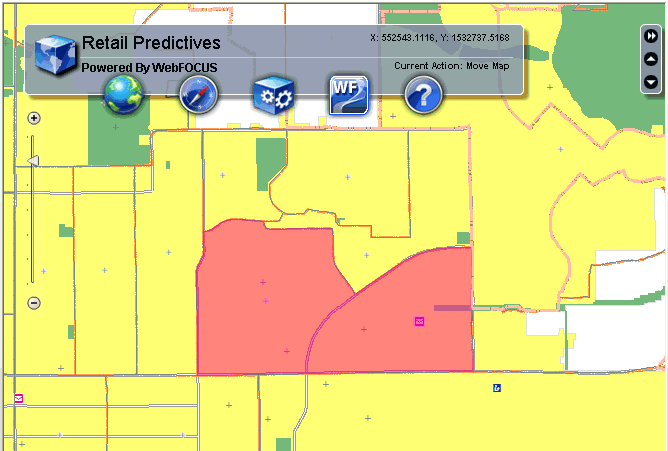
Click Show in Map.
In the left pane, the region that is represented by the
selected FIPS code is highlighted in the map, as shown in the following
image.
x
Procedure: How to Generate Reports Using the WebFOCUS Report Widget
-
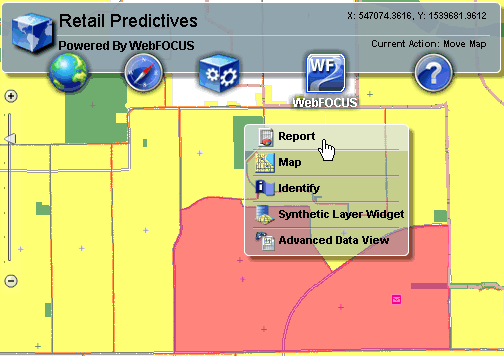
Click the WebFOCUS icon
in the left pane, and select Report from
the context menu, as shown in the following image.
The Report widget
opens, as shown in the following image.
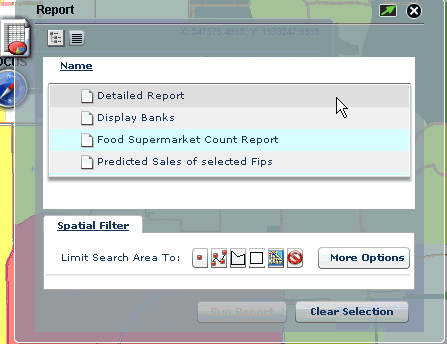
The following reports
can be generated based on the selection that is made:
-
Select the type of report you want to generate and select
a Spatial Filter (for example, Rectangle).
-
Minimize the Report widget.
-
Make a map selection using the selected Spatial Filter
and return to the Report widget.
-
Click Run Report.
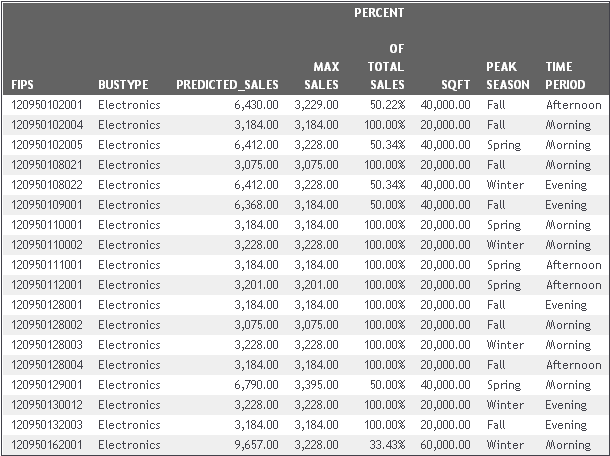
For example, the following report provides predicted sales
for the Electronics business type category in a selected region.
x
Procedure: How to Use the WebFOCUS Map Widget
-
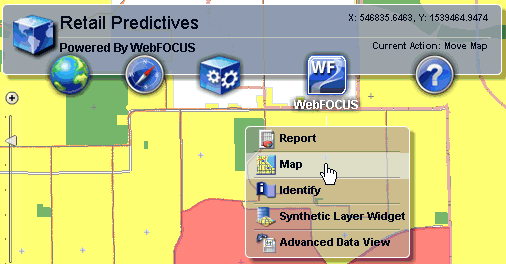
Click the WebFOCUS icon
in the left pane, and select Map from the
context menu, as shown in the following image.
The Map widget opens,
as shown in the following image.
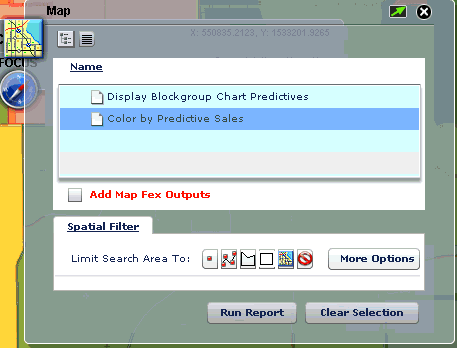
The following map
options are available:
-
Display Blockgroup Chart Predictives. Displays
charts as popups on the map that are based on selected stores in
a region.
-
Color by Predictive Sales. Colors census blocks (FIPS)
for predicted values using parameters on the page. Higher values
are colored in red and the lowest values are colored in green. For
example:

-
Select the type of report (for example, Display Blockgroup
Chart Predictives) you want to generate and select a Spatial Filter
(for example, Rectangle).
-
Minimize the Map widget.
-
Make a map selection using the selected Spatial Filter
and return to the Map widget.
-
Click Run Report.
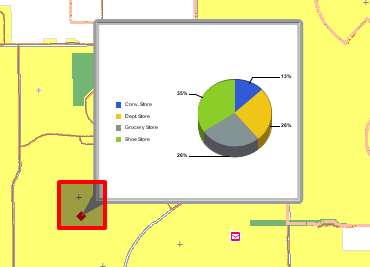
For example, the following report displays a popup chart
on the map that is based on the selection made using the Rectangle
Spatial Filter.
