
In this section: How to: Reference: |
The Explorer is the main window from which all tools and facilities are accessed.
The Explorer contains the following features:
|
Feature |
Description |
|---|---|
|
Menu Bar |
Displays pull-down menus. Menus and options are context-sensitive and are determined by the active window or selected object. Depending upon your location in the Explorer, certain menu options may be inactive. |
|
Main Toolbar |
Contains buttons that provide quick access to commonly performed functions. These buttons always appear on the toolbar, but their behavior is determined by the active window and the selected object. Depending upon your location in the Explorer, certain toolbar buttons may be inactive. For details, see Main Toolbar. |
|
Commands Toolbar |
Provides quick access to any external program added in the External Tools tab of the Developer Studio Options dialog box. When you add an external program, it appears as an additional icon on the Commands Toolbar. Select the icon from the Commands Toolbar to launch the external tool. For details, see Commands Toolbar. |
|
Explorer Toolbar |
Contains buttons to perform the available operations for the selected object and area in the Explorer window. Depending upon the object you select, certain toolbar buttons may be inactive or unavailable. For details, see Introducing WebFOCUS and Developer Studio . |
|
Title Bar |
The title bar of the active window has information for the specific window or tool. |
|
Tool Tip |
Small descriptive text labels appear when the mouse pointer rests on a toolbar button. |
|
Status Bar |
Displays current status of WebFOCUS (either idle or busy executing a report or other procedure) and a description of the Main toolbar buttons. Click and hold a button to display a description. |
The Main toolbar contains buttons that provide quick access to commonly performed functions. These buttons always appear on the toolbar. However, the behavior they initiate varies based on the active window and the object selected. Therefore, depending upon your location in the project, certain toolbar buttons may be inactive. The following table gives a brief description of the buttons on the Main toolbar.
|
Button |
Operation |
|---|---|
|
|
Enables you to create a new object. The object type is determined by the selected folder or item. For example, when the Projects on localhost folder is selected, the Create a Project dialog box opens. When the Master Files folder is selected, the Add Master File dialog box opens. |
|
|
Opens the appropriate tool to graphically edit the selected object. For example, if a Master File is selected, the Synonym Editor opens. |
|
|
Opens the Text Editor and enables you to edit the FOCUS commands for the selected object. |
|
|
Executes the selected object (FOCUS procedure, HTML file). Multi-selected objects are executed in the order in which they are selected. To run multi-selected objects, select Window, then Options, and in the General tab of the Developer Studio Options dialog box which opens, select the Use new browser to execute option. Note: A special pointer appears whenever you execute a procedure and are still able to perform another task. For example, if you execute a report that takes a while to run, your pointer may appear as both an hourglass and an arrow pointer while you are in Report Painter. You are free to continue to style or format your next report, or perform tasks from the Projects folder while a previous request is being processed. However, you cannot run your next request until the previous one has completed processing. You may also turn on the Message Viewer which enables you to see messages including error messages, informational messages, and Dialogue Manager commands. These messages appear in a separate frame below the report output and serve as a good resource for debugging an application. |
|
|
The Cancel running objects button allows users to stop running requests. Users can stop running requests from multiple WebFOCUS Environments that are configured in Developer Studio. A dialog displays the environments where a user has made a connection when pressing the Cancel running objects button. The last environment used to run a job is selected by default. Users can select to stop running jobs from additional environments as well. Information in the dialog will display with the status of the stop request. When multiple jobs are submitted for processing, they are queued on the Reporting Server and only active jobs for the user will be stopped. |
|
|
Opens a new Explorer window. |
|
|
Opens the WebFOCUS Maintain Development Environment (MDE). This is only available in the Developer Studio edition. |
|
|
Opens the Command Console, where you can enter commands and see the results of your queries. See Using the Command Console in the Developing Reporting Applications manual for more information. |
|
|
Opens the Reporting Server Console used for project development. This is where you configure the local server for creating Developer Studio applications. If you are performing remote project development, the Server Console for the remote server will be launched. For more information, see Introducing WebFOCUS and Developer Studio . |
You may edit the list of registered external tools by clicking the Add or Modify External Tools icon, located on the Commands Toolbar. The Commands Toolbar enables you to access any external program added in the External Tools tab of the Developer Studio Options dialog box. When you add an external program, it appears as an additional icon on the Commands Toolbar. Select the icon from the Commands Toolbar to launch the external tool.
An example of the Commands Toolbar is shown in the image below.
Note: If the Commands Toolbar is not shown, click View, and then click Commands Toolbar. When the Commands Toolbar is checked, the Commands Toolbar displays.
To add external tools, click the Add or Modify External Tools icon. The Developer Studio Options dialog box opens. The External Tools tab is selected, as shown in the following image.
Note: The Commands Toolbar is not visible by default.
The Commands Toolbar appears next to the Main toolbar, displaying the Add or Modify External Tools icon. You may move, dock, or float this toolbar.
 icon.
icon.
The Developer Studio Options dialog box opens at the External Tools tab.
The external tool appears as an additional icon on the Commands Toolbar.
Note: The external program added is also available from the Command menu.
Tip: You may also access the Developer Studio Options dialog box by selecting Options from the Windows menu. Click the External Tools tab to see the list of registered external tools.
The QuickLinks dialog box provides links to the most popular Developer Studio tools, enabling you to launch them more quickly.
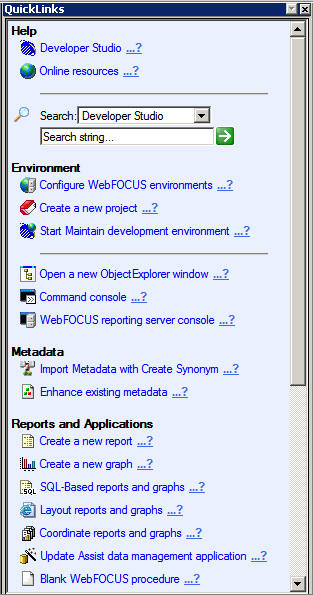
The links to tools are grouped into the following categories:
You can view bubble help for each link by positioning your mouse pointer over it. You can also see a description of the task by clicking the question mark icon. The arrows to the left of the categories (Help, Environment, Metadata, and so on) expand and collapse the items in that category.
To access the QuickLinks dialog box, select QuickLinks from the View menu when you are in the Developer Studio Explorer.
| WebFOCUS |


